You're probably here because you've heard the whispers.
That the market open is where the real money is made, or lost, in day trading.
Maybe you've tried to jump in, felt like you were wrestling a greased pig, and ended up bruised.
Or you're just starting out, staring at those charts at 9:30 AM EST, wondering where the heck to even begin.
I get it. The market open is a beast. It's fast, it's furious, and it can chew you up and spit you out if you don't have a plan.
But here's the thing: with the right Day Trading Stock Strategy For The Open Of The Market, it's also where some of the clearest, most explosive moves happen.
This isn't financial advice, by the way. Just me sharing what I've learned from getting punched in the face by the market, and then figuring out how to punch back.
If you want to analyze stocks the professional way, TradingView is the top charting and trading community platform.
Why the First Hour? It's Not Just Hype, It's Math.
Ever wonder why everyone talks about the market open like it's some magical time?
It's not magic. It's pure, unadulterated opportunity, driven by human psychology and cold, hard data.
Think about it: all the news, earnings reports, and overnight sentiment have been building up.
When the bell rings, all that pent-up energy explodes into action.
This creates massive volatility and volume, which are the lifeblood of a day trader.
Studies have even shown that a significant portion of a stock's daily range often forms within the first hour .
Meaning, if you can capture even a piece of that initial move, you're already ahead of the game.
It's like showing up to a gold rush right when the first nuggets are being found.
Everyone else is still packing their bags, and you're already digging.
My Go-To Play: The Opening Range Breakout (ORB)
Out of all the strategies I've tested, tweaked, and sometimes cursed, the Opening Range Breakout, or ORB, is my absolute favorite for the market open.
It's simple, it's powerful, and it capitalizes directly on that early morning chaos.
Here's the gist: you define aninitial price range, usually within the first few minutes of trading.
Then, you wait for the price to break out of that range, either to the upside or downside, with conviction.
It sounds almost too easy, right? That's because the devil, as always, is in the details.
Ready to trade? Discover the Best Stock Trading Platforms
What is an Opening Range Breakout (ORB)? The Blueprint.
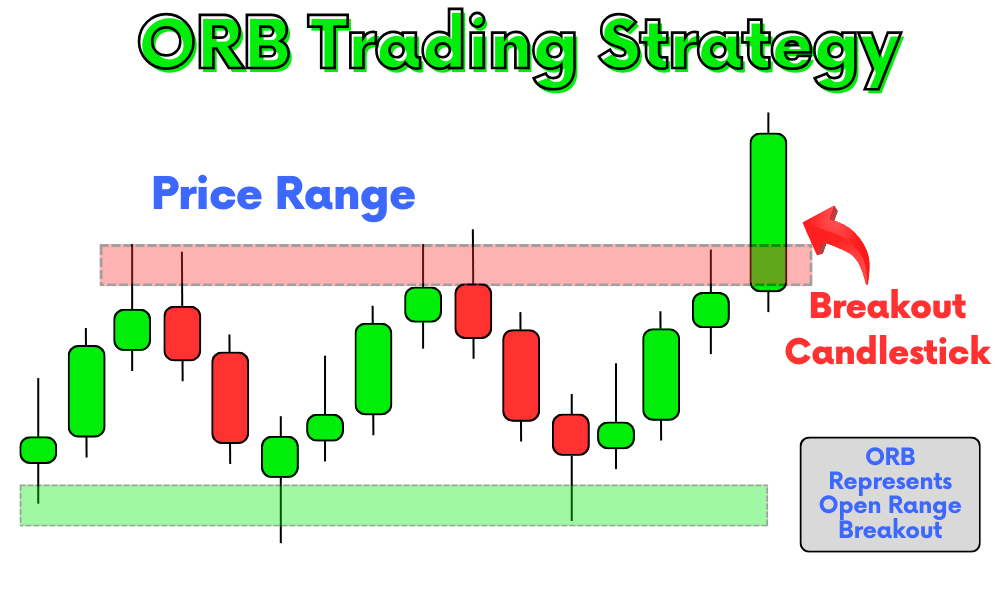
An ORB is essentially a trading setup where a stock, often fueled by news or a catalyst, establishes a tight consolidation range right after the market opens.
Once that range is set, you're looking for a decisive move, abreakout, above or below that range, usually on strong volume .
It’s about capturing the initial directional bias of the stock for the day.
Think of it like a coiled spring. The market open winds it up, and the ORB is when it finally releases.
Identifying the ORB: My 5-Minute Rule
Forget the 1-minute chart. It’s a chaotic mess, full of noise and false signals.
It’s like trying to hear a whisper in a rock concert. You’ll just get confused.
I stick to the 5-minute chart for ORB setups. It gives you enough data to see real price action without getting caught in the micro-scalping traps .
Each candle takes five minutes to form. This allows for clearer patterns and more reliable signals.
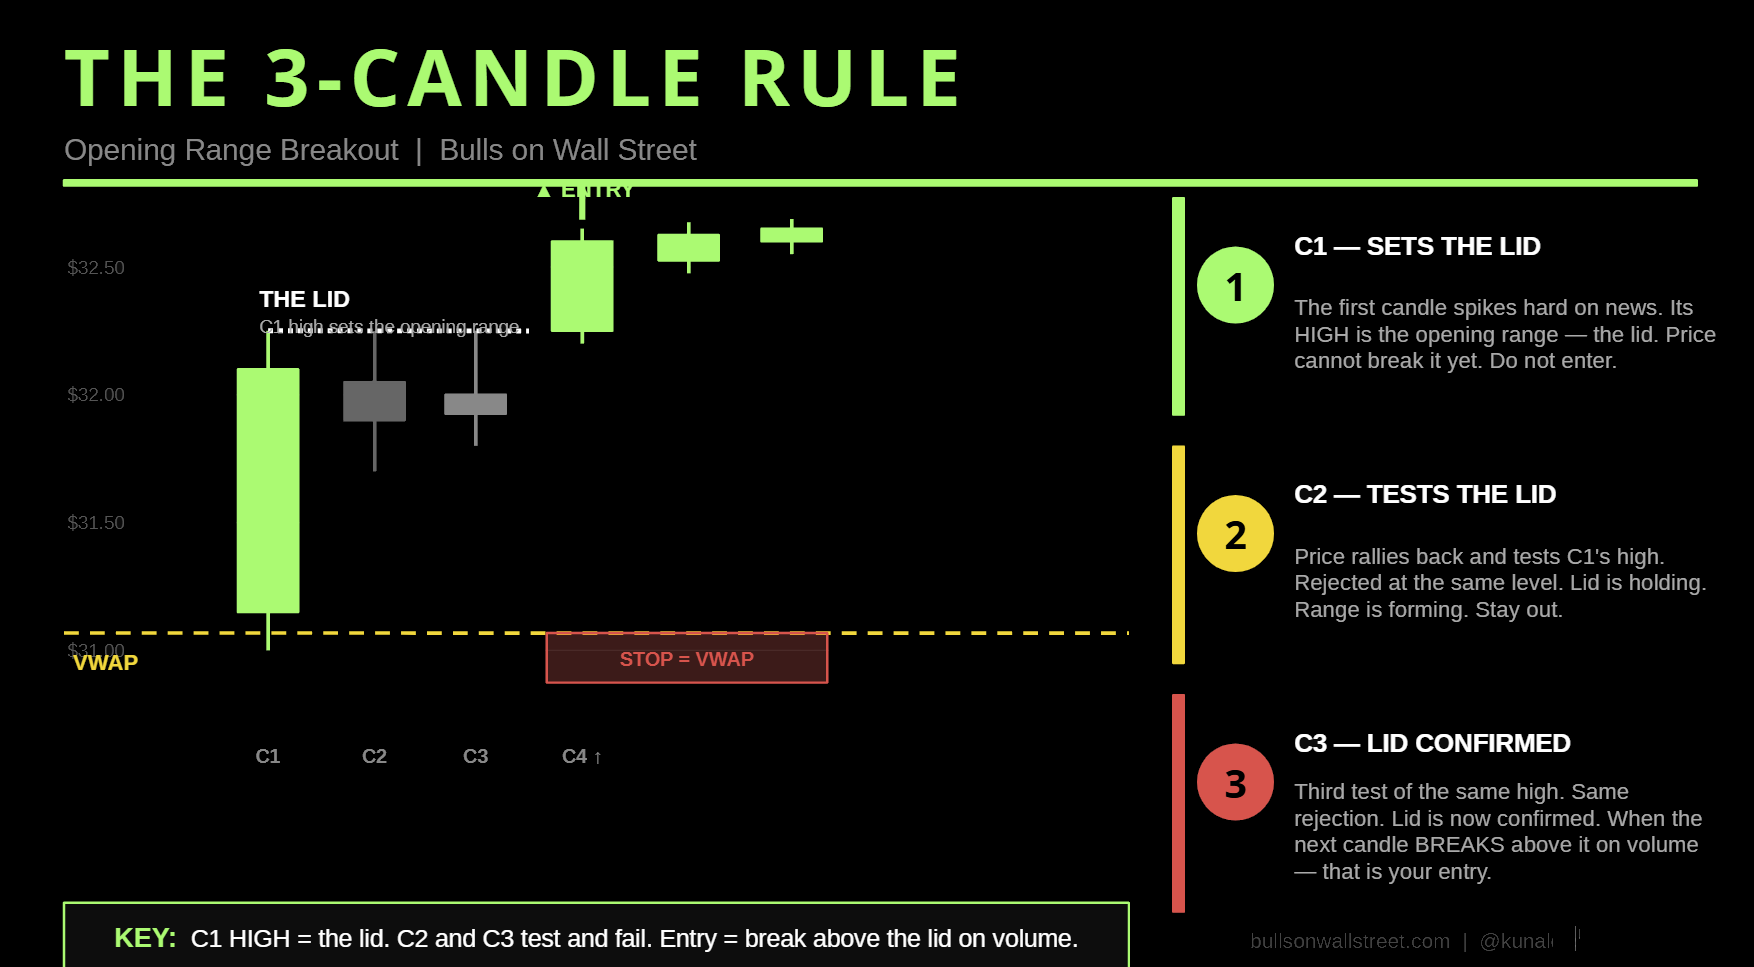
The 3-Candle Rule: Your Entry Trigger
This is crucial. You need a minimum of three 5-minute candles to form your consolidation range .
•Candle 1: Pure reaction. Chaos. Don't even think about it.
•Candle 2: Starts to settle. The dust begins to clear.
•Candle 3: This is where the range gets defined. You can see the“lid” forming.
When Candle 3 breaks above the high of that consolidation (for a long trade) or below the low (for a short trade) on volume, that’s your entry .
Over 50% of ORBs trigger on the third candle. It’s a high-probability setup if you wait for it.
The Lid: What a Clean ORB Looks Like
Imagine a tight, contained consolidation after the initial gap. The highs of these candles should be similar, and so should the lows.
When you draw a line across the tops, it should look flat, like a lid holding the price down.
When the stock finally breaks through that lid, the pressure releases, and you get your move.
If it’s sloppy, with wide, overlapping candles and no defined range, skip it. There are always other trades.
Here’s a visual to help you grasp the concept:
Entry and Exit: Keep it Tight, Keep it Real
This is where most traders mess up. They get in, but they don’t know when to get out.
Or worse, they let a small loss turn into a catastrophic one.
Entry Rules:
•Catalyst: Real news, earnings, something driving the stock. No catalyst, no trade.
•Relative Volume: At least 2x the average. We need fuel for the fire.
•Daily Chart: Supports the move. Don’t gap into resistance. Look left, always look left.
•5-Minute Chart: Minimum 3 candles forming a tight lid. Buy the break of that lid on volume .
Stop Loss: Your Lifeline
This is non-negotiable. Your stop loss goes at the VWAP (Volume Weighted Average Price) .
Not under the consolidation low. That gets wicked out too easily.
If the price falls below VWAP, buyers have lost control. Get out. Immediately. No questions asked.
Target: Let it Run, But Don’t Be Greedy
I don’t have a hard target. I use ATR (Average True Range) to scale out at 1x ATR, and then I trail with the 9 EMA (Exponential Moving Average) .
If the “Bone Zone” (the shaded area between the 9 EMA and 20 EMA) holds, let it run. If the 9 EMA breaks, exit.
It’s about capturing the meat of the move, not trying to squeeze every last penny.
Risk Management: The Only Rule That Matters
This isn’t a casino. You’re a business owner. And in business, you protect your capital.
Never risk more than 1% of your account on any single trade .
Your stop distance to VWAP determines your share size. Calculate it. Stick to it.
If you have a $50,000 account, your max loss is $500. If your stop is $0.30 away, you can trade 1,667 shares.
No exceptions. This is how you stay in the game long enough to get good.
Common ORB Mistakes: Learn From My Scars
I’ve made every single one of these mistakes. And they hurt. Don’t be me.
•Buying Candle 1 or 2: You’re guessing. The range isn’t formed. Wait for the lid.
•Trading Sloppy ORBs: Messy consolidation, no defined range? Skip it. There’s always another setup.
•Ignoring the Daily Chart: Gapping into resistance on the daily chart drastically lowers your probability. Always look left.
•Using the 1-Minute Chart: Too noisy. Too many false signals. Stick to the 5-minute.
•Stop Under Consolidation Low: Gets taken out on normal wicks. VWAP is your anchor.
•Trading After 11:00 AM EST: Volume and volatility drop off a cliff. The setup degrades. Move on to other strategies for the midday.
•Chasing a Missed Entry: If the stock already ran a dollar past your break, don’t chase it. Wait for the first pullback instead.
Here’s another look at how the 3-candle rule works:
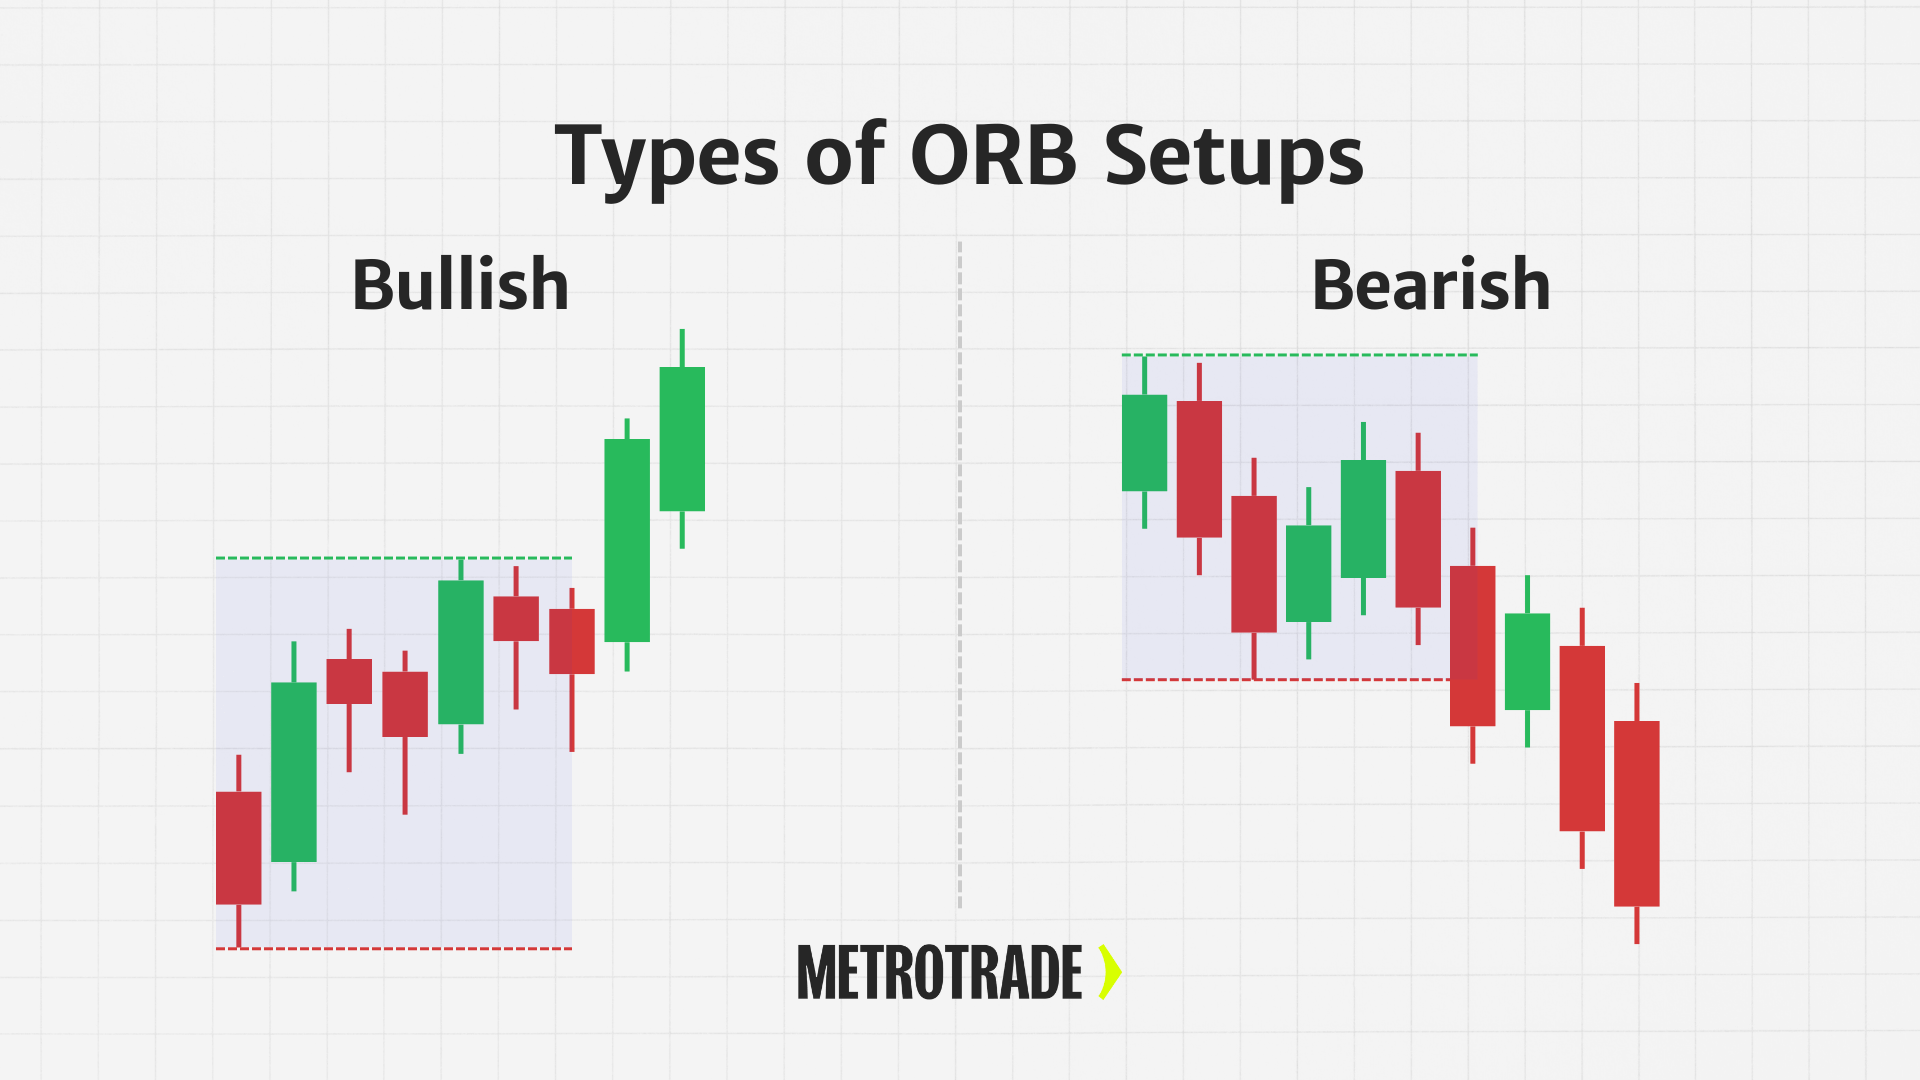
And an illustration of different ORB setups:
FAQs
What exactly is a Day Trading Stock Strategy For The Open Of The Market?
It’s a specific plan you follow to trade stocks during the first hour or so after the market opens, capitalizing on the increased volatility and volume.
Why is the Opening Range Breakout (ORB) considered effective?
Because it leverages the natural tendency of stocks to establish a directional bias early in the trading day, often after significant overnight news or catalysts. It’s about riding that initial momentum.
How long should I wait for the opening range to form?
I recommend using the first three 5-minute candles to define your opening range. This gives the market enough time to settle slightly and form a clearerrange before you look for a breakout.
Can I use the ORB strategy for short selling?
Absolutely. The rules are mirrored. You look for a stock that gaps down on negative news, forms a tight lid, and then breaks below that range on volume. Your stop would be above VWAP in this case .
What if I miss the initial ORB entry?
Don't chase it. If you miss the initial breakout, wait for the first pullback. Often, after a strong ORB, the stock will pull back to key levels like the 9 EMA or theBone Zone, offering a secondary, lower-risk entry opportunity .
Is this strategy suitable for all market conditions?
It works best in bull market conditions, especially when stocks are trading above their 50-day simple moving average. In choppy or bear markets, the probability of success can decrease, so adjust your risk accordingly or sit on your hands .
Final Thoughts: Master the Open, Master Your Trading.
Look, day trading isn't about being right all the time. It's about managing your risk, having a clear plan, and executing it flawlessly.
The Day Trading Stock Strategy For The Open Of The Market using the ORB is a powerful tool in your arsenal.
But it's just a tool. You're the craftsman.
Practice it. Refine it. And most importantly, respect the market.
It'll humble you faster than anything else.
Stay disciplined, stay focused, and go get what's yours.


No comments:
Post a Comment