Ever found yourself staring at a trading chart, wondering what that tiny cross-shaped candle means? You're not alone. Many traders, myself included, have been there, scratching our heads at the Doji candlestick pattern. It looks simple, but understanding how to trade it with high probability can seriously up your game.
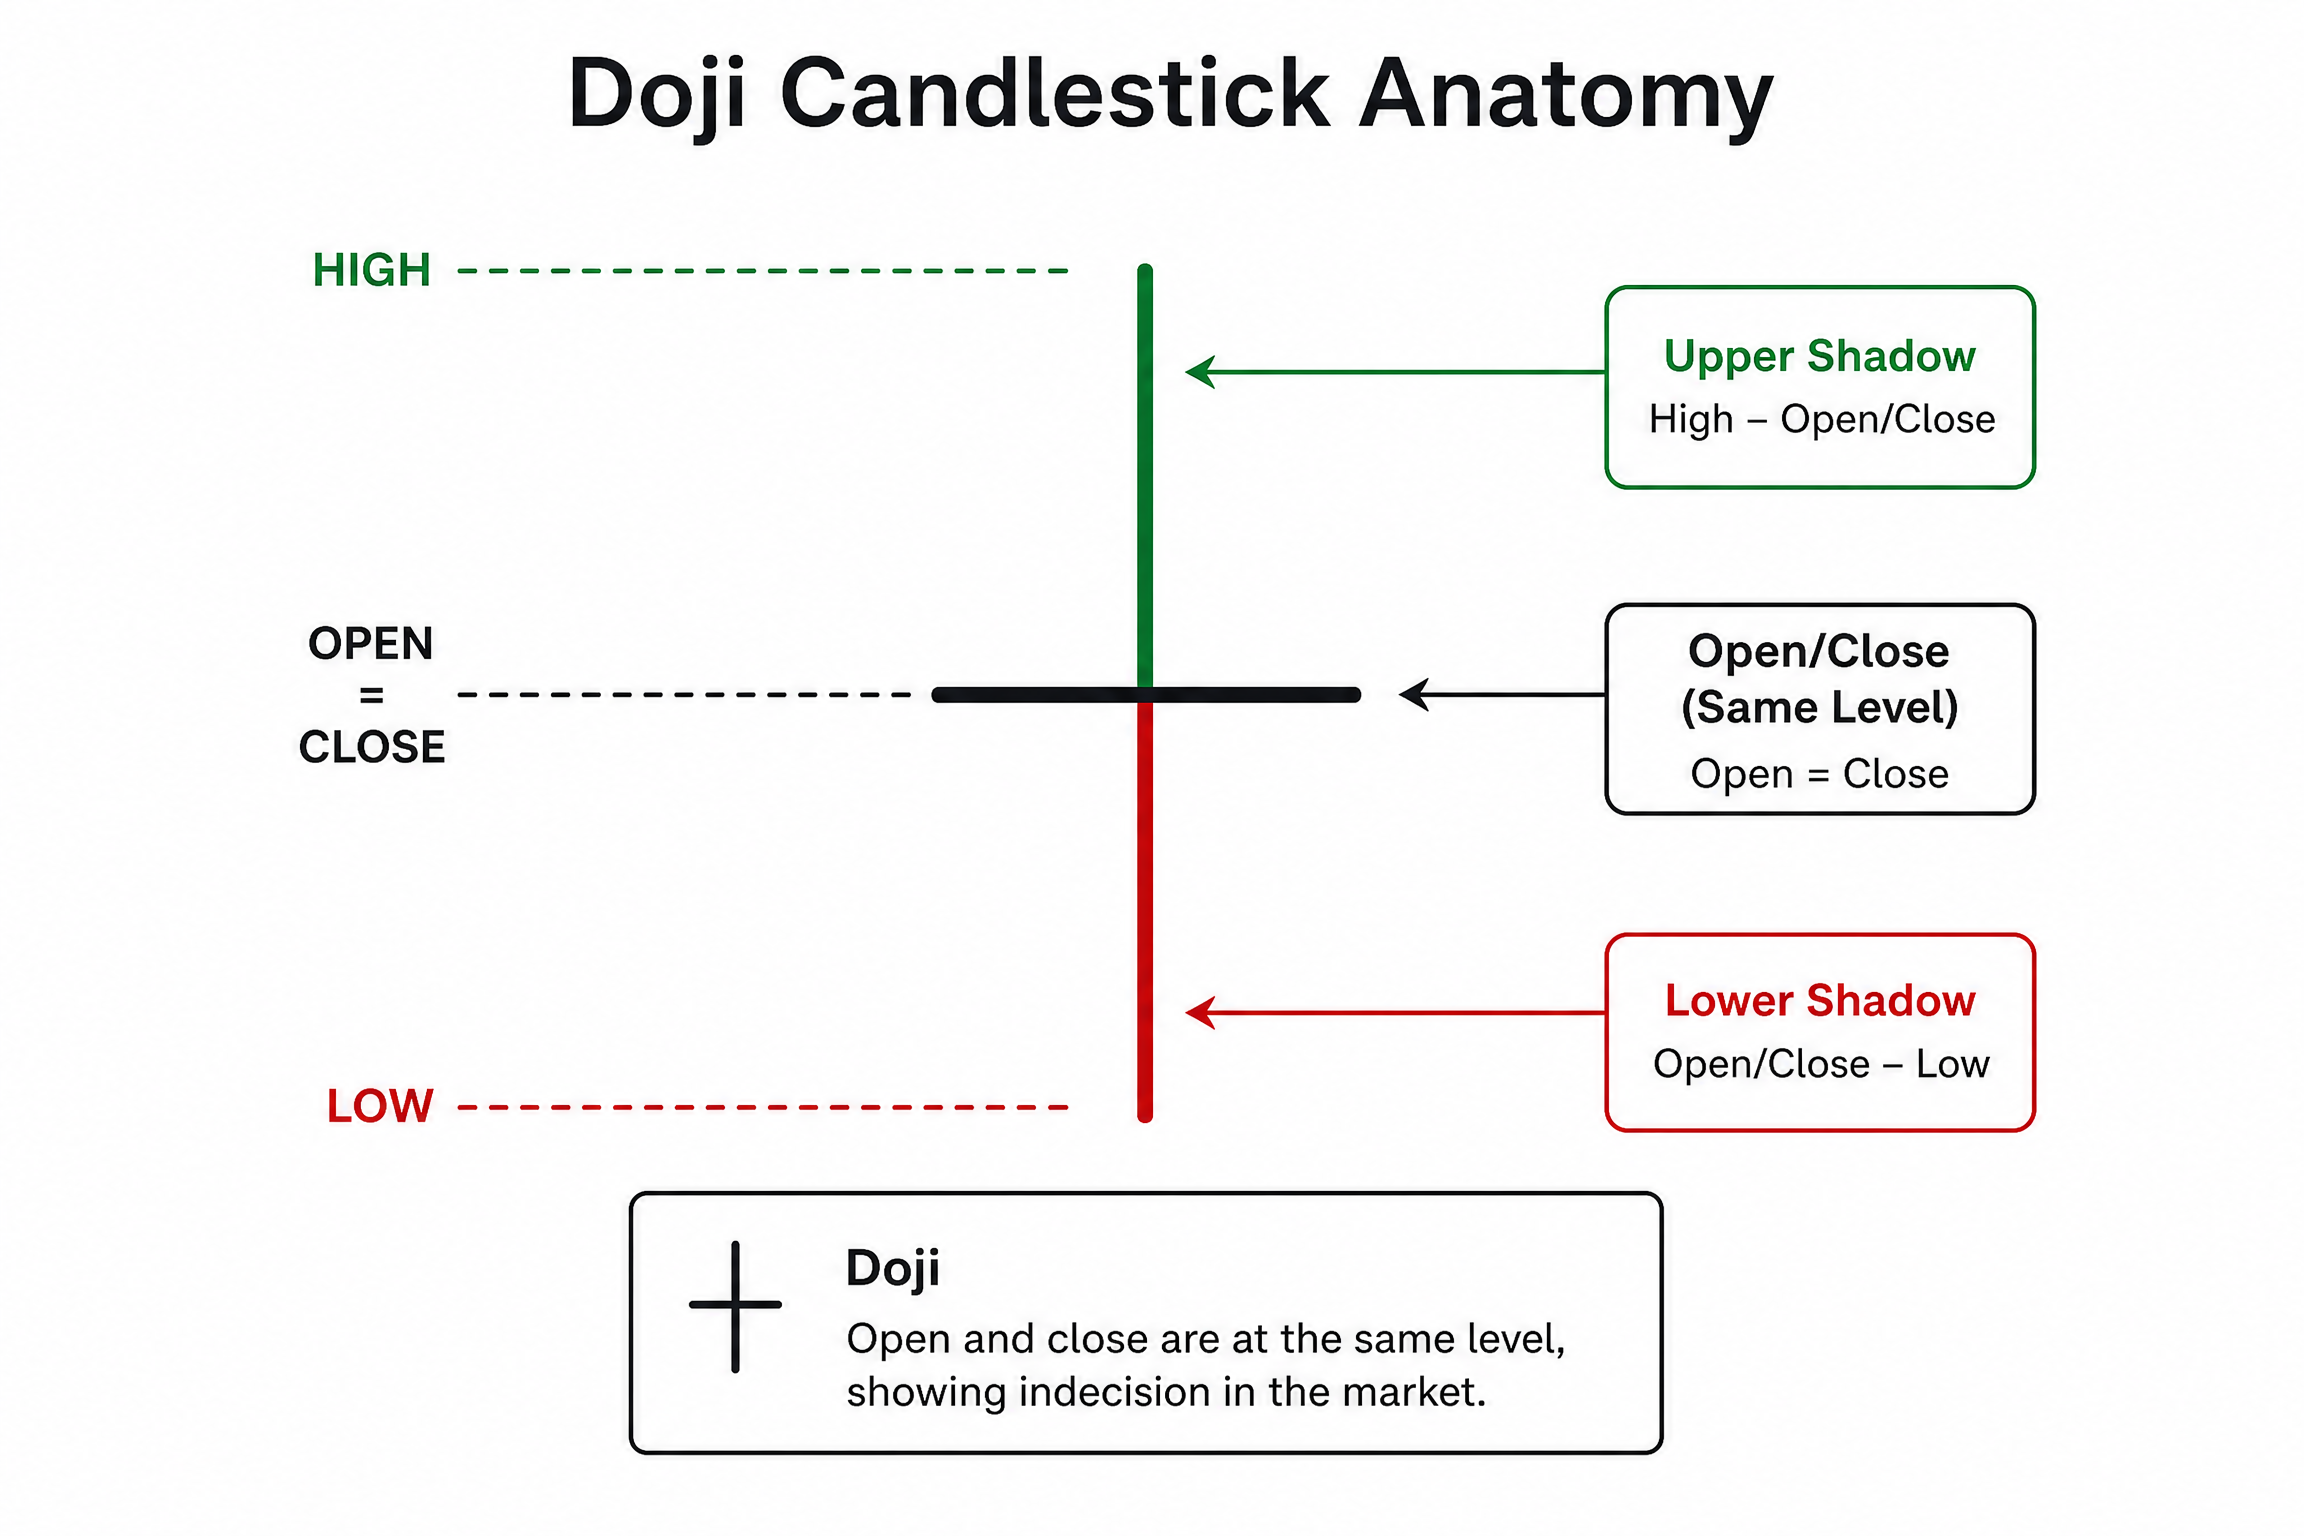
So, what exactly is a Doji, and why should you care? At its core, a Doji signals indecision in the market. It forms when the opening and closing prices of an asset are virtually the same, creating a cross, plus sign, or inverted cross shape. The wicks (shadows) can vary, showing how far prices moved during the period before settling back near the open.
What's the Deal with Doji Candlesticks?
Think of a Doji as a momentary truce between buyers (bulls) and sellers (bears). Neither side could gain a clear advantage, and the price ended up right where it started. This indecision is crucial because it often precedes a significant move or a reversal in the existing trend.
The Anatomy of a Doji
To really get it, let's break down its parts:
•Open and Close are (Almost) Equal: This is the defining characteristic. It means the battle between buyers and sellers resulted in a stalemate.
•Upper Shadow: Shows the highest price reached during the period.
•Lower Shadow: Shows the lowest price reached during the period.
It's like the market took a deep breath, paused, and is now deciding its next direction. This pause can be a golden opportunity if you know how to read it.
IF YOU WANT TO TAKE YOUR STOCK INVESTMENT TO THE NEXT LEVEL, READ MY CAPITALIST EXPLOITS REVIEW HERE
Different Flavors of Doji: Not All Are Created Equal
Just like coffee, Dojis come in different types, and each tells a slightly different story. Knowing these nuances is key to trading the Doji candlestick pattern with high probability.
The Main Types I Look For:
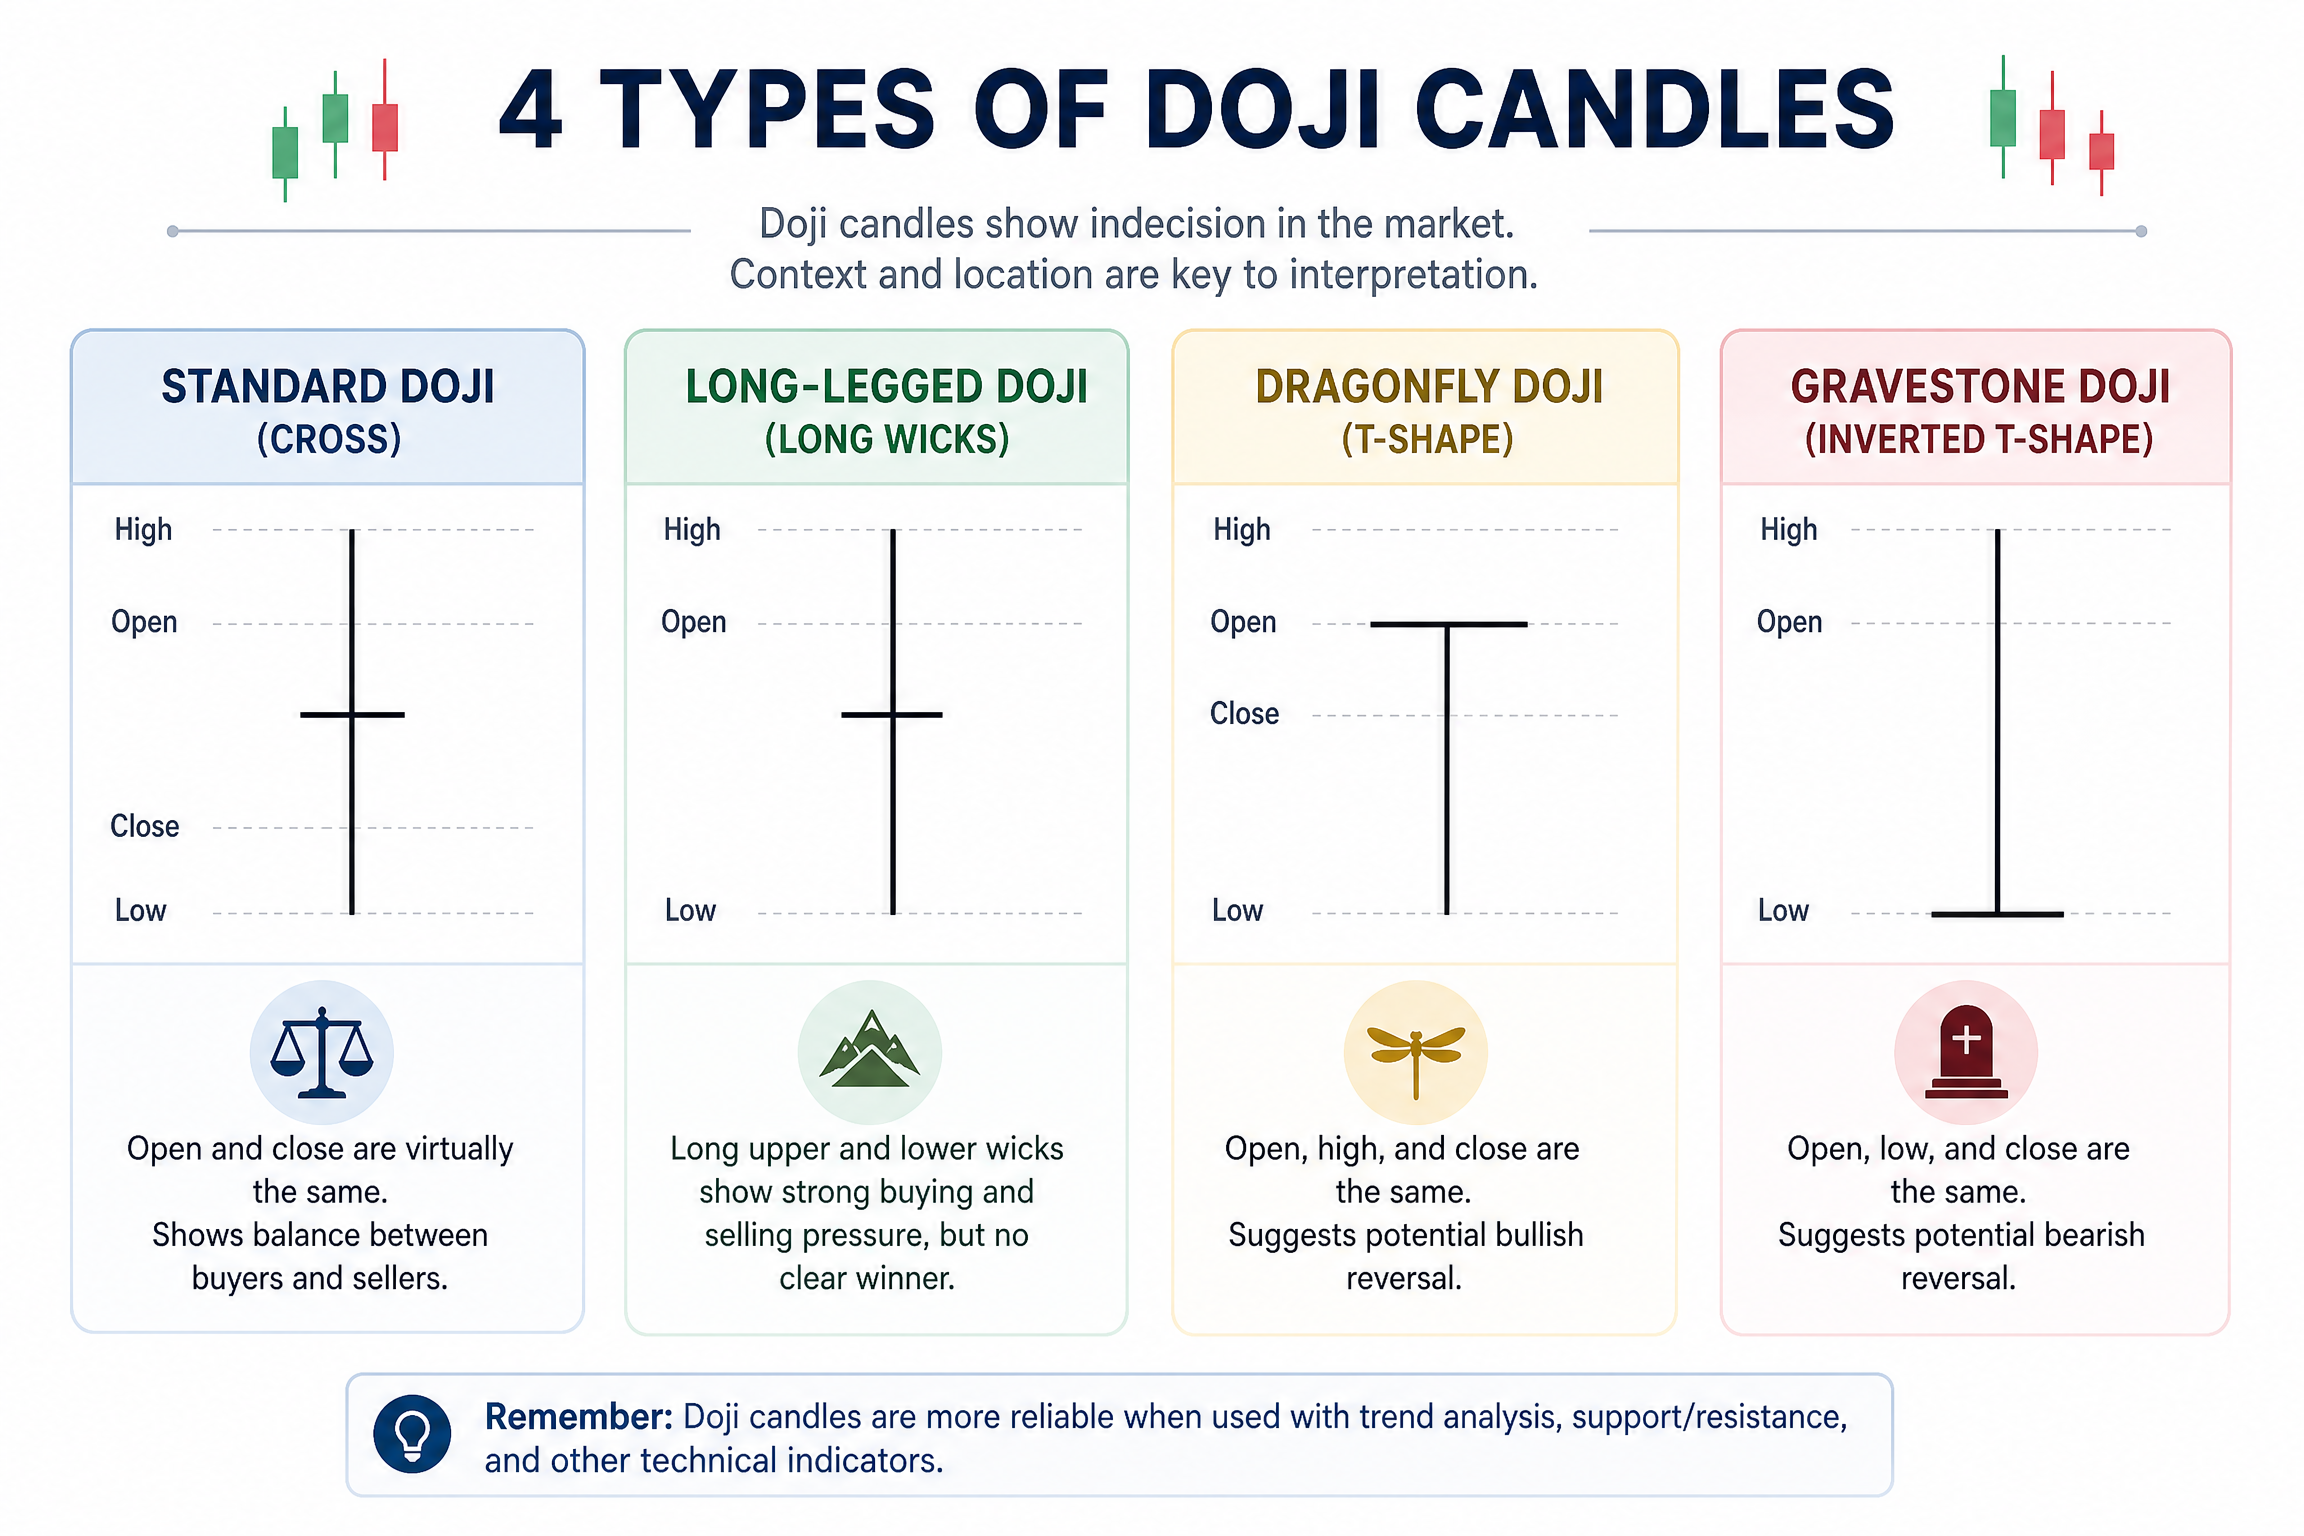
•Standard Doji (Cross Doji): The classic cross shape. Pure indecision.
•Long-Legged Doji: Has long upper and lower shadows, indicating extreme indecision and volatility during the period, but still closing near the open. It means a big fight happened, but no one won.
•Dragonfly Doji: Looks like aT-shape. The open, high, and close prices are virtually the same, with a long lower shadow. This suggests sellers pushed prices down, but buyers brought them back up. Often a bullish reversal signal.
•Gravestone Doji: The inverted T-shape. The open, low, and close prices are virtually the same, with a long upper shadow. This means buyers pushed prices up, but sellers brought them back down. Often a bearish reversal signal.
How I Trade the Doji Candlestick Pattern with High Probability
Now, here's where the rubber meets the road. A Doji on its own is just a signal of indecision. To turn it into a high-probability trade, you need context. I always combine Dojis with other technical analysis tools like support and resistance levels, trend analysis, and volume.
You can check this trading patterns cheatsheet for more setups.
My Go-To Strategy: Context is King!
1.Identify the Trend: Is the market in an uptrend, downtrend, or sideways? A Doji's significance changes dramatically based on the prevailing trend.
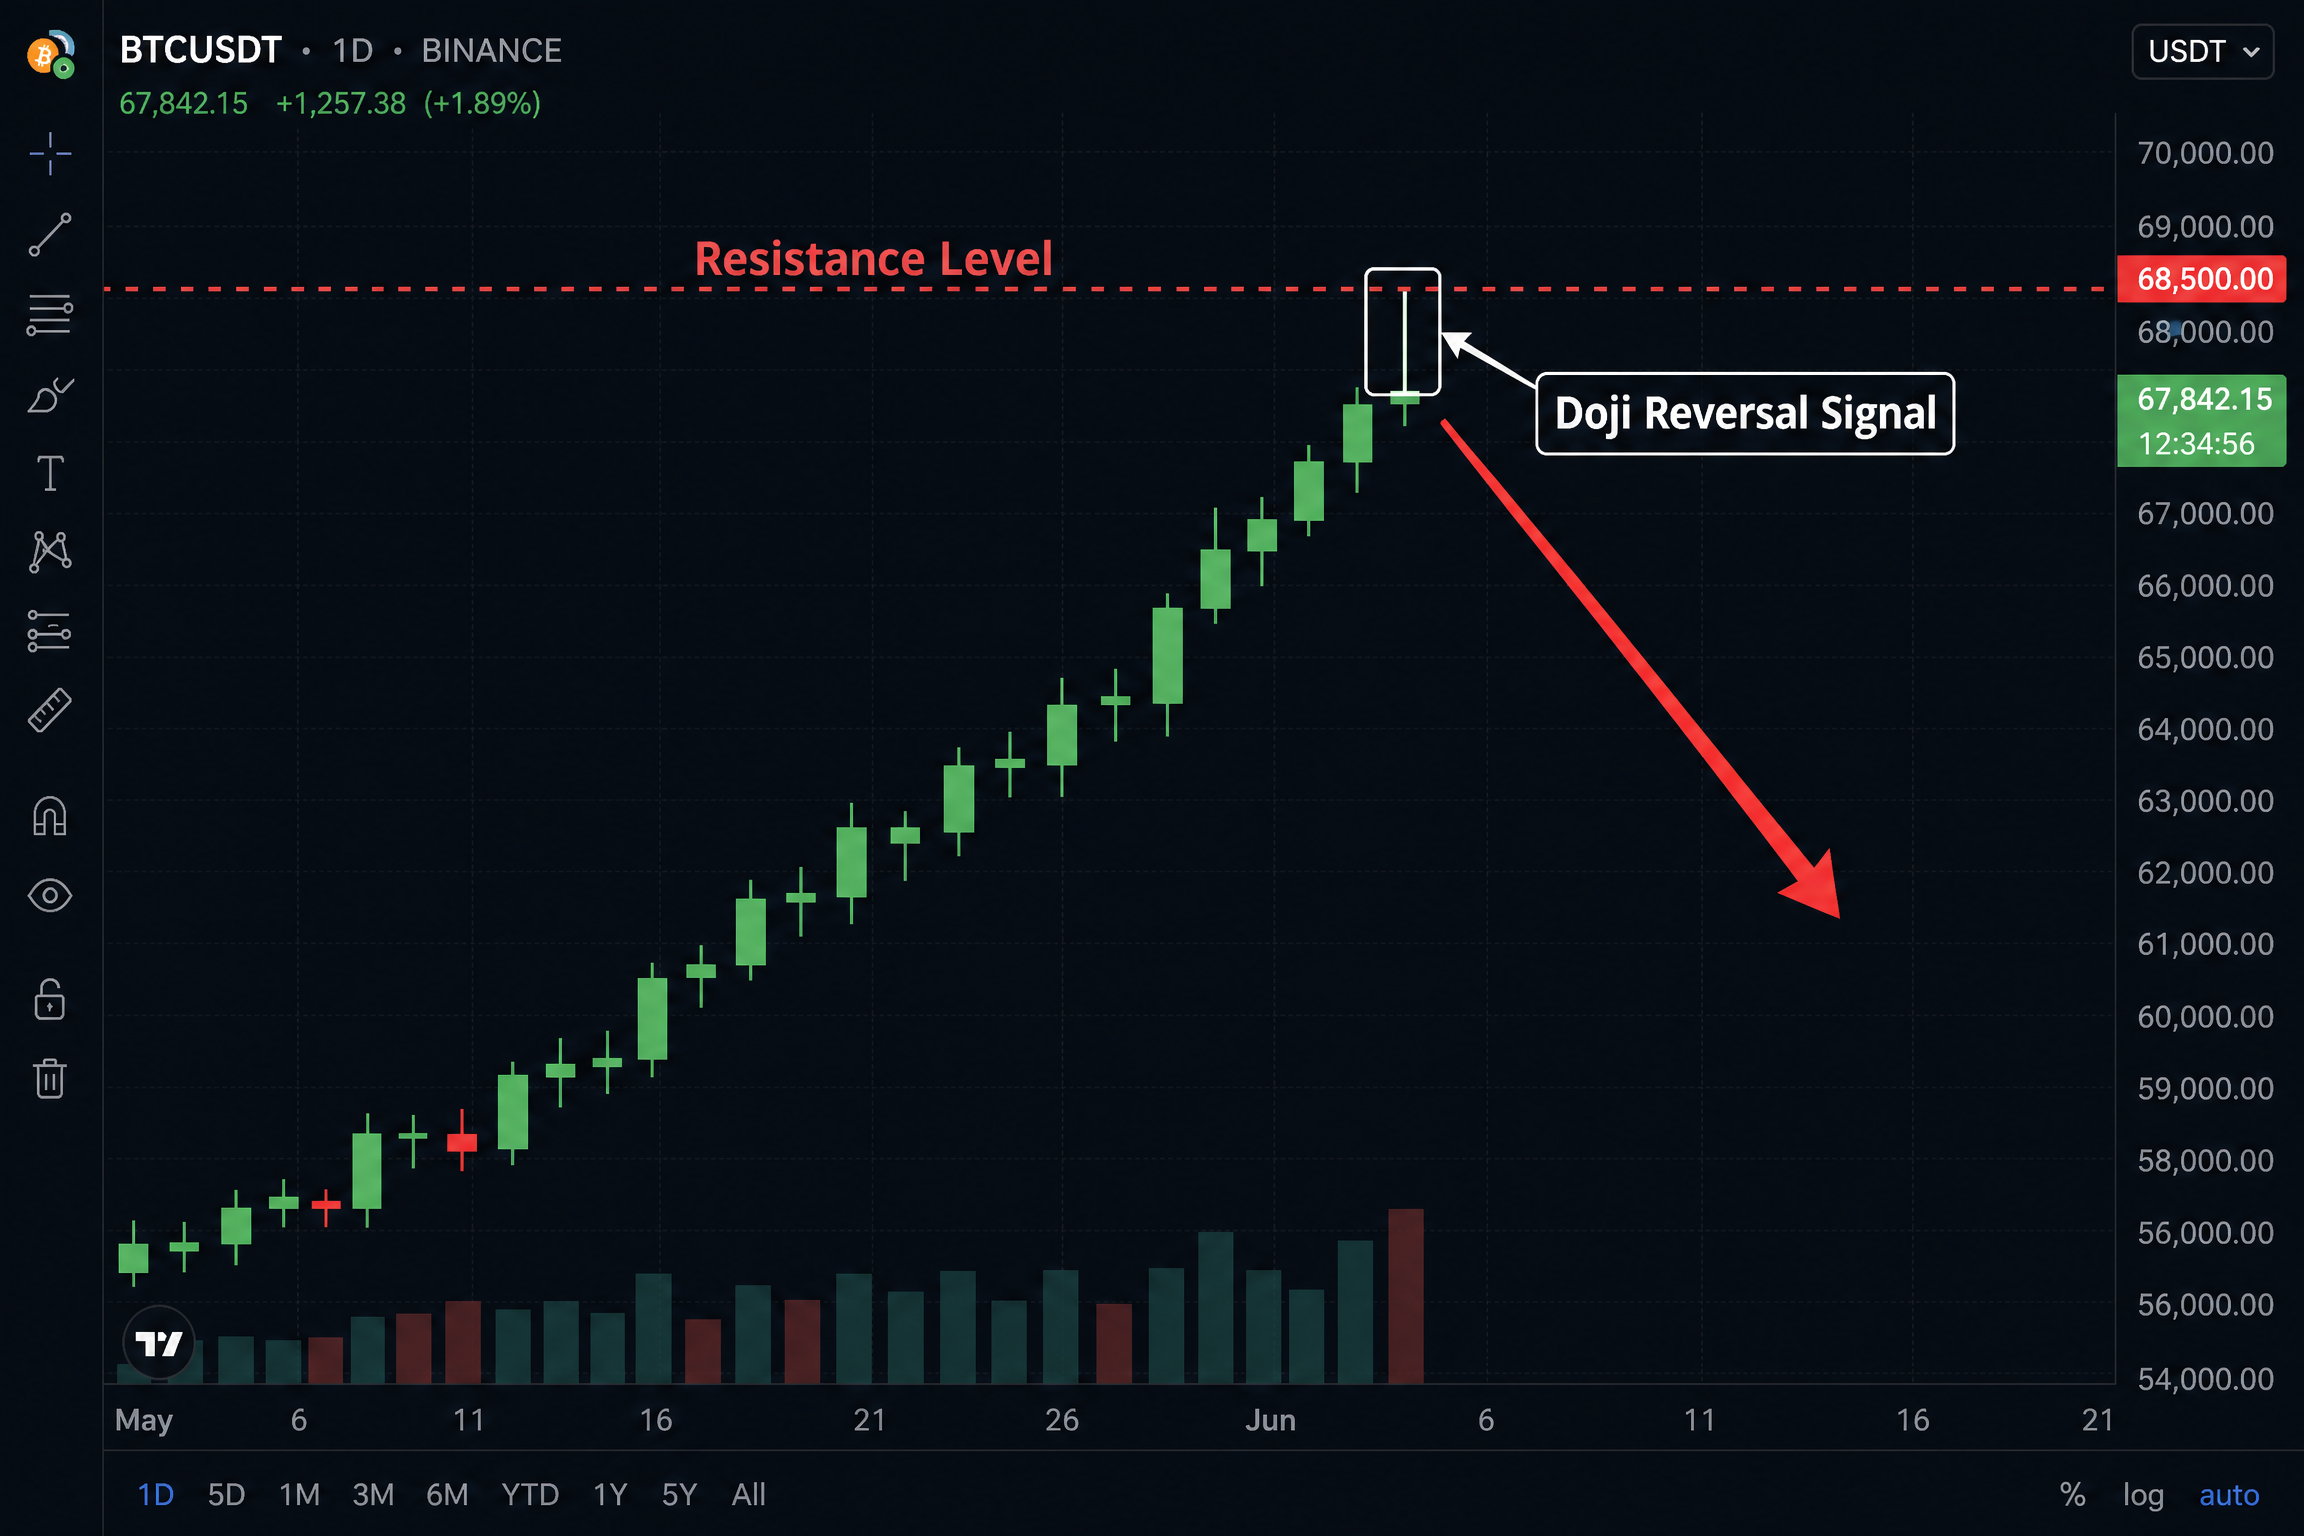
•In an Uptrend: A Doji, especially a Gravestone Doji, at the top of an uptrend can signal that buyers are exhausted, and a reversal might be coming. This is a potential shorting opportunity.
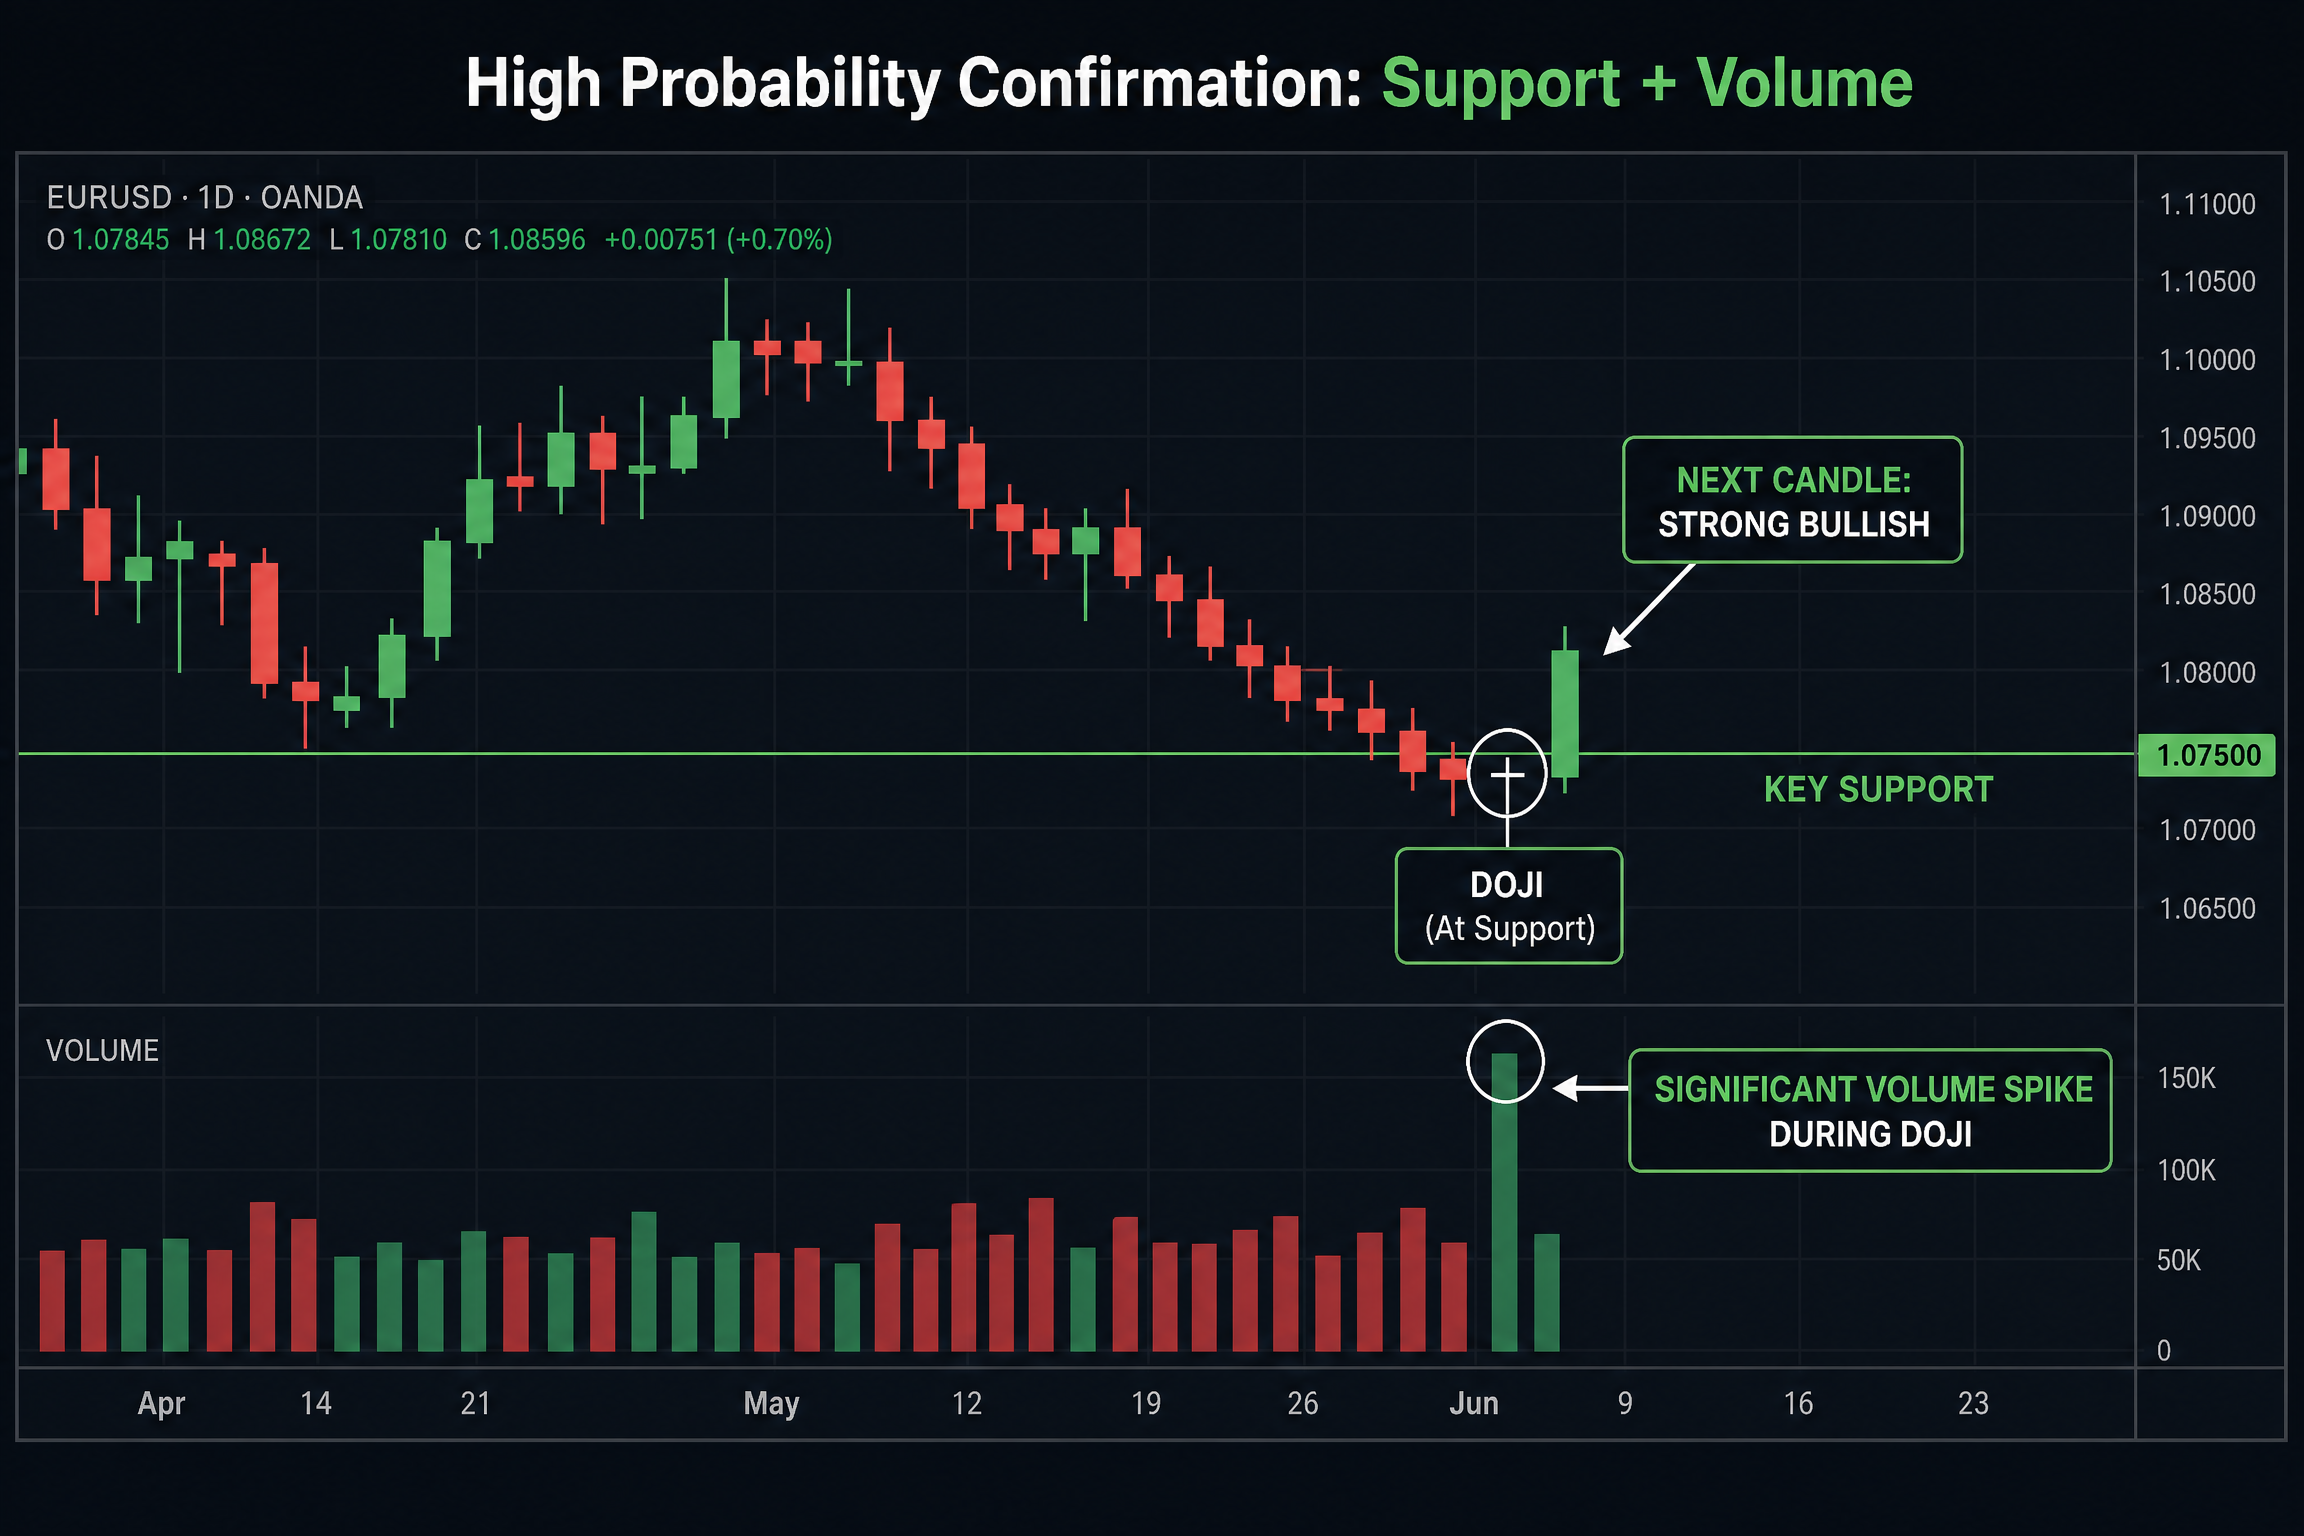
•In a Downtrend: A Doji, particularly a Dragonfly Doji, at the bottom of a downtrend can suggest sellers are losing steam, and a bullish reversal could be imminent. This is a potential buying opportunity.
•In a Sideways Market: Dojis here are less significant. They just confirm the ongoing indecision.
2.Look for Support and Resistance: These are crucial. A Doji forming at a strong support or resistance level significantly increases its reliability as a reversal signal. Think of these levels as battlegrounds where the indecision of the Doji becomes a critical turning point.
•Example: If I see a Gravestone Doji forming right at a major resistance level after a strong uptrend, my ears perk up. This confluence of signals screamspotential bearish reversal.
1.Confirm with Volume: Volume is my secret sauce. A Doji with high volume is far more significant than one with low volume. High volume during a Doji means a lot of participants were involved in that indecision, making the potential reversal or continuation more powerful.
•Pro Tip: If a Doji forms at support with high volume, and the next candle is a strong bullish candle, that's a high-probability setup for a long trade. The market is telling you it tried to go lower, couldn't, and now buyers are stepping in with conviction.
My Trading Checklist for High-Probability Doji Setups:
•Is there a clear trend? (Uptrend for bearish Doji, Downtrend for bullish Doji)
•Is the Doji forming at a significant support or resistance level?
•Is there above-average volume accompanying the Doji?
•What does the next candle look like? (Confirmation is key!)
Common Questions About Trading Doji Candlesticks
Let's tackle some of the questions I often hear when chatting about Dojis.
Q: Is a Doji always a reversal signal?
A: Not always! While often associated with reversals, a Doji primarily signals indecision. Its meaning is heavily dependent on the context of the preceding trend and other confirming indicators. Sometimes, it can even be a continuation pattern, indicating a pause before the trend resumes.
Q: How important is volume with a Doji?
A: Extremely important! A high-volume Doji suggests strong participation and a more significant battle between buyers and sellers. This makes the indecision, and thus the potential outcome, more impactful. Low volume Dojis are generally less reliable.
Q: Can I trade Dojis on any timeframe?
A: Yes, Dojis appear on all timeframes, from one-minute charts to monthly charts. However, like most candlestick patterns, they tend to be more reliable on higher timeframes (e.g., daily, weekly) because they represent a broader consensus of market participants.
Q: What's the best way to confirm a Doji signal?
A: Always wait for the candle after the Doji to confirm the direction. If a bearish Doji forms at resistance, and the next candle is a strong bearish candle, that's your confirmation. Similarly, for a bullish Doji at support, look for a strong bullish follow-through candle.
Wrapping Up: Trading The Doji Candlestick Pattern With High Probability
So, there you have it. The Doji candlestick pattern, when understood and used with proper context and confirmation, can be a powerful tool in your trading arsenal. It's not about blindly following a single candle, but rather using it as a piece of a larger puzzle to identify high-probability trading opportunities. Remember, trading is all about probabilities, not certainties.
This article is for informational purposes only and is not financial advice. Always do your own research and consult with a financial professional before making any investment decisions.