Ever felt like you're always a step behind in the market? Like you see a great move happening, but by the time you jump in, it's already too late?
We've all been there, staring at charts, wondering if there's a way to catch those big reversals before everyone else.
What if I told you there's a simple, yet powerful, candlestick pattern that can give you an early heads-up? It's called the Bullish Engulfing Candlestick Pattern, and it's one of my favorite signals for spotting potential trend reversals.
What Exactly is a Bullish Engulfing Pattern?
Think of it like a tug-of-war between buyers and sellers. For a while, the sellers have been winning, pushing prices down. Then, suddenly, the buyers come in with such force that they completely overpower the sellers.
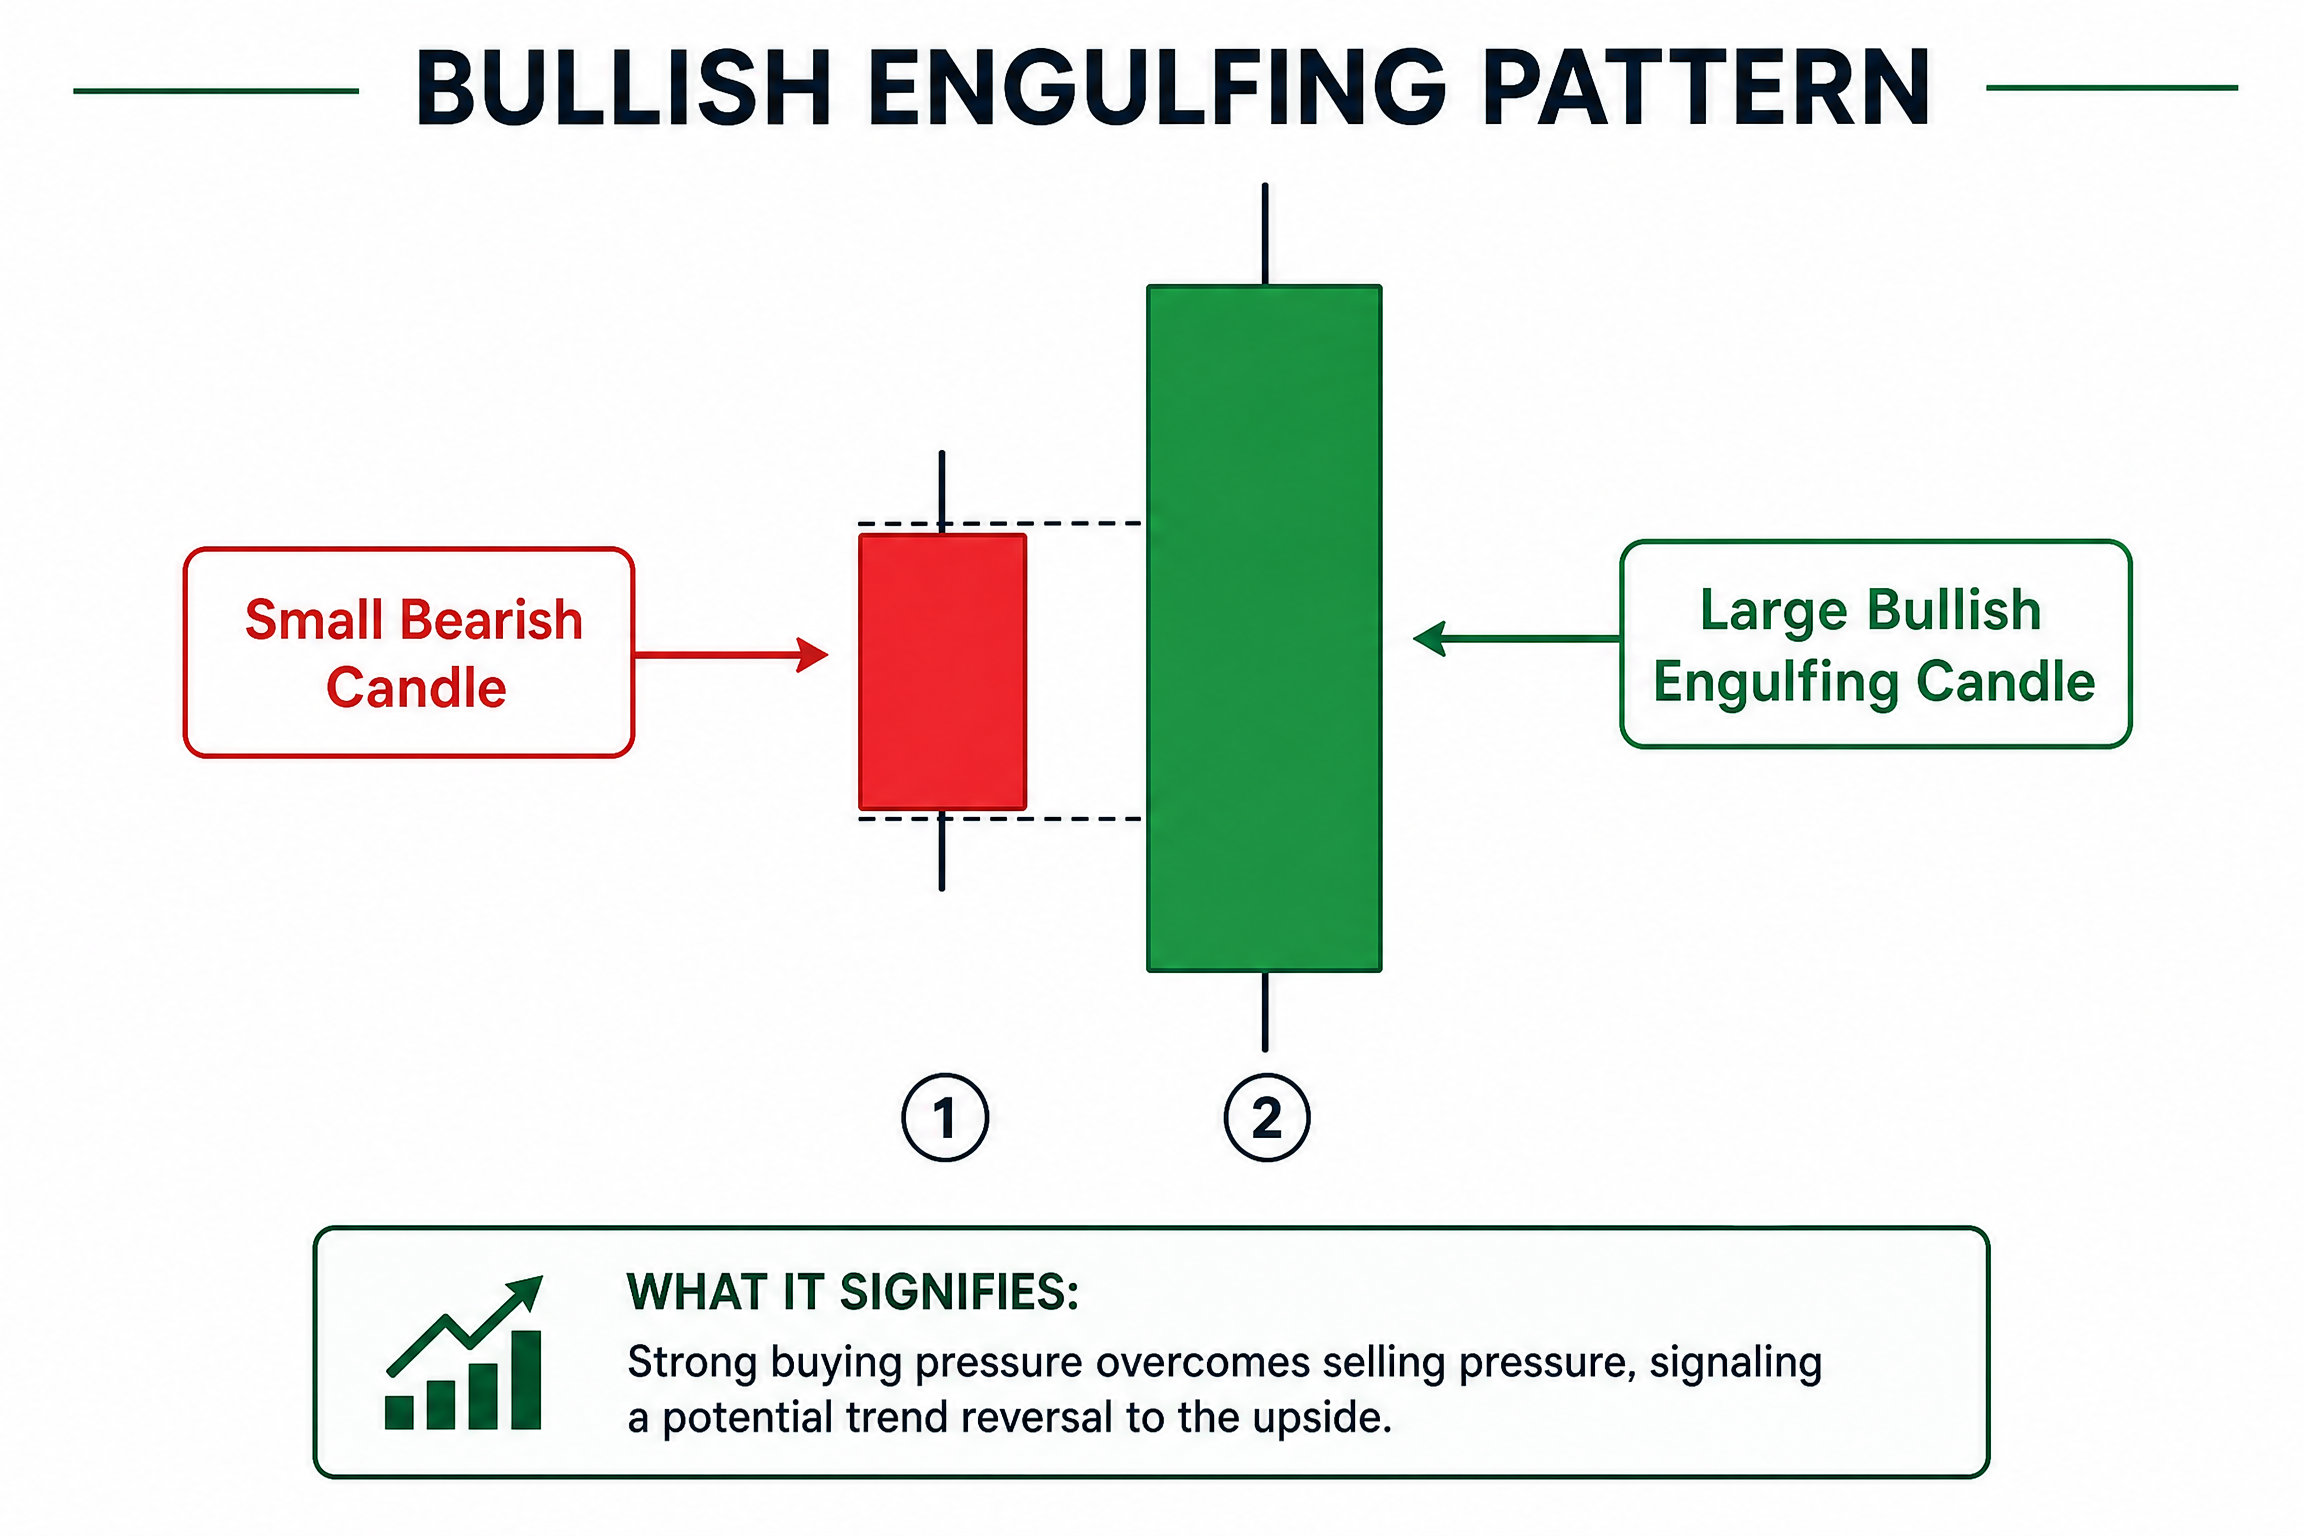
That's what a bullish engulfing pattern shows us. It's a two-candlestick formation, usually appearing after a downtrend. The first candle is small and bearish (red), showing that sellers are still in control, but maybe losing a bit of steam.
The second candle is the star of the show: a large bullish (green) candle that opens lower than the previous day's close but then closes significantly higher, completely 'engulfing' the body of the first red candle. It's like the green candle just swallowed the red one whole!
This visual tells us that buying pressure has dramatically overcome selling pressure, signaling a potential shift in momentum from bearish to bullish.
IF YOU WANT TO TAKE YOUR STOCK INVESTMENT TO THE NEXT LEVEL, READ MY CAPITALIST EXPLOITS REVIEW HERE
Why Does This Pattern Work So Well?
The power of the bullish engulfing pattern lies in its market psychology. The small bearish candle initially suggests a continuation of the downtrend, perhaps trapping some late sellers.
But then, the strong bullish candle comes in, not only negating the previous day's losses but pushing prices even higher. This move often catches sellers off guard, forcing them to cover their positions, which adds even more buying pressure.
It's a clear statement from the market: "We're not going down anymore; we're heading up!" This shift in sentiment can be a powerful catalyst for a new uptrend.
How I Trade the Bullish Engulfing Pattern
Now, spotting the pattern is one thing, but knowing how to trade it effectively is where the real magic happens. I've learned that not all bullish engulfing patterns are created equal. Context is everything.
You can check this trading patterns cheatsheet for more setups.
Look for Confluence: The Sweet Spot
I always look for this pattern to form at key levels or areas of interest. A bullish engulfing pattern in the middle of nowhere isn't as reliable as one that appears at a strong support level or after a significant pullback.
This is what we call confluence – when multiple factors align to strengthen a signal. For me, the most reliable setups involve three key characteristics:
1.A clear bullish engulfing bar: The pattern itself must be well-formed, with the green candle truly engulfing the red one.
2.At a swing low: This pattern is a reversal signal, so it needs to appear at the bottom of a downtrend or a significant pullback within an uptrend.
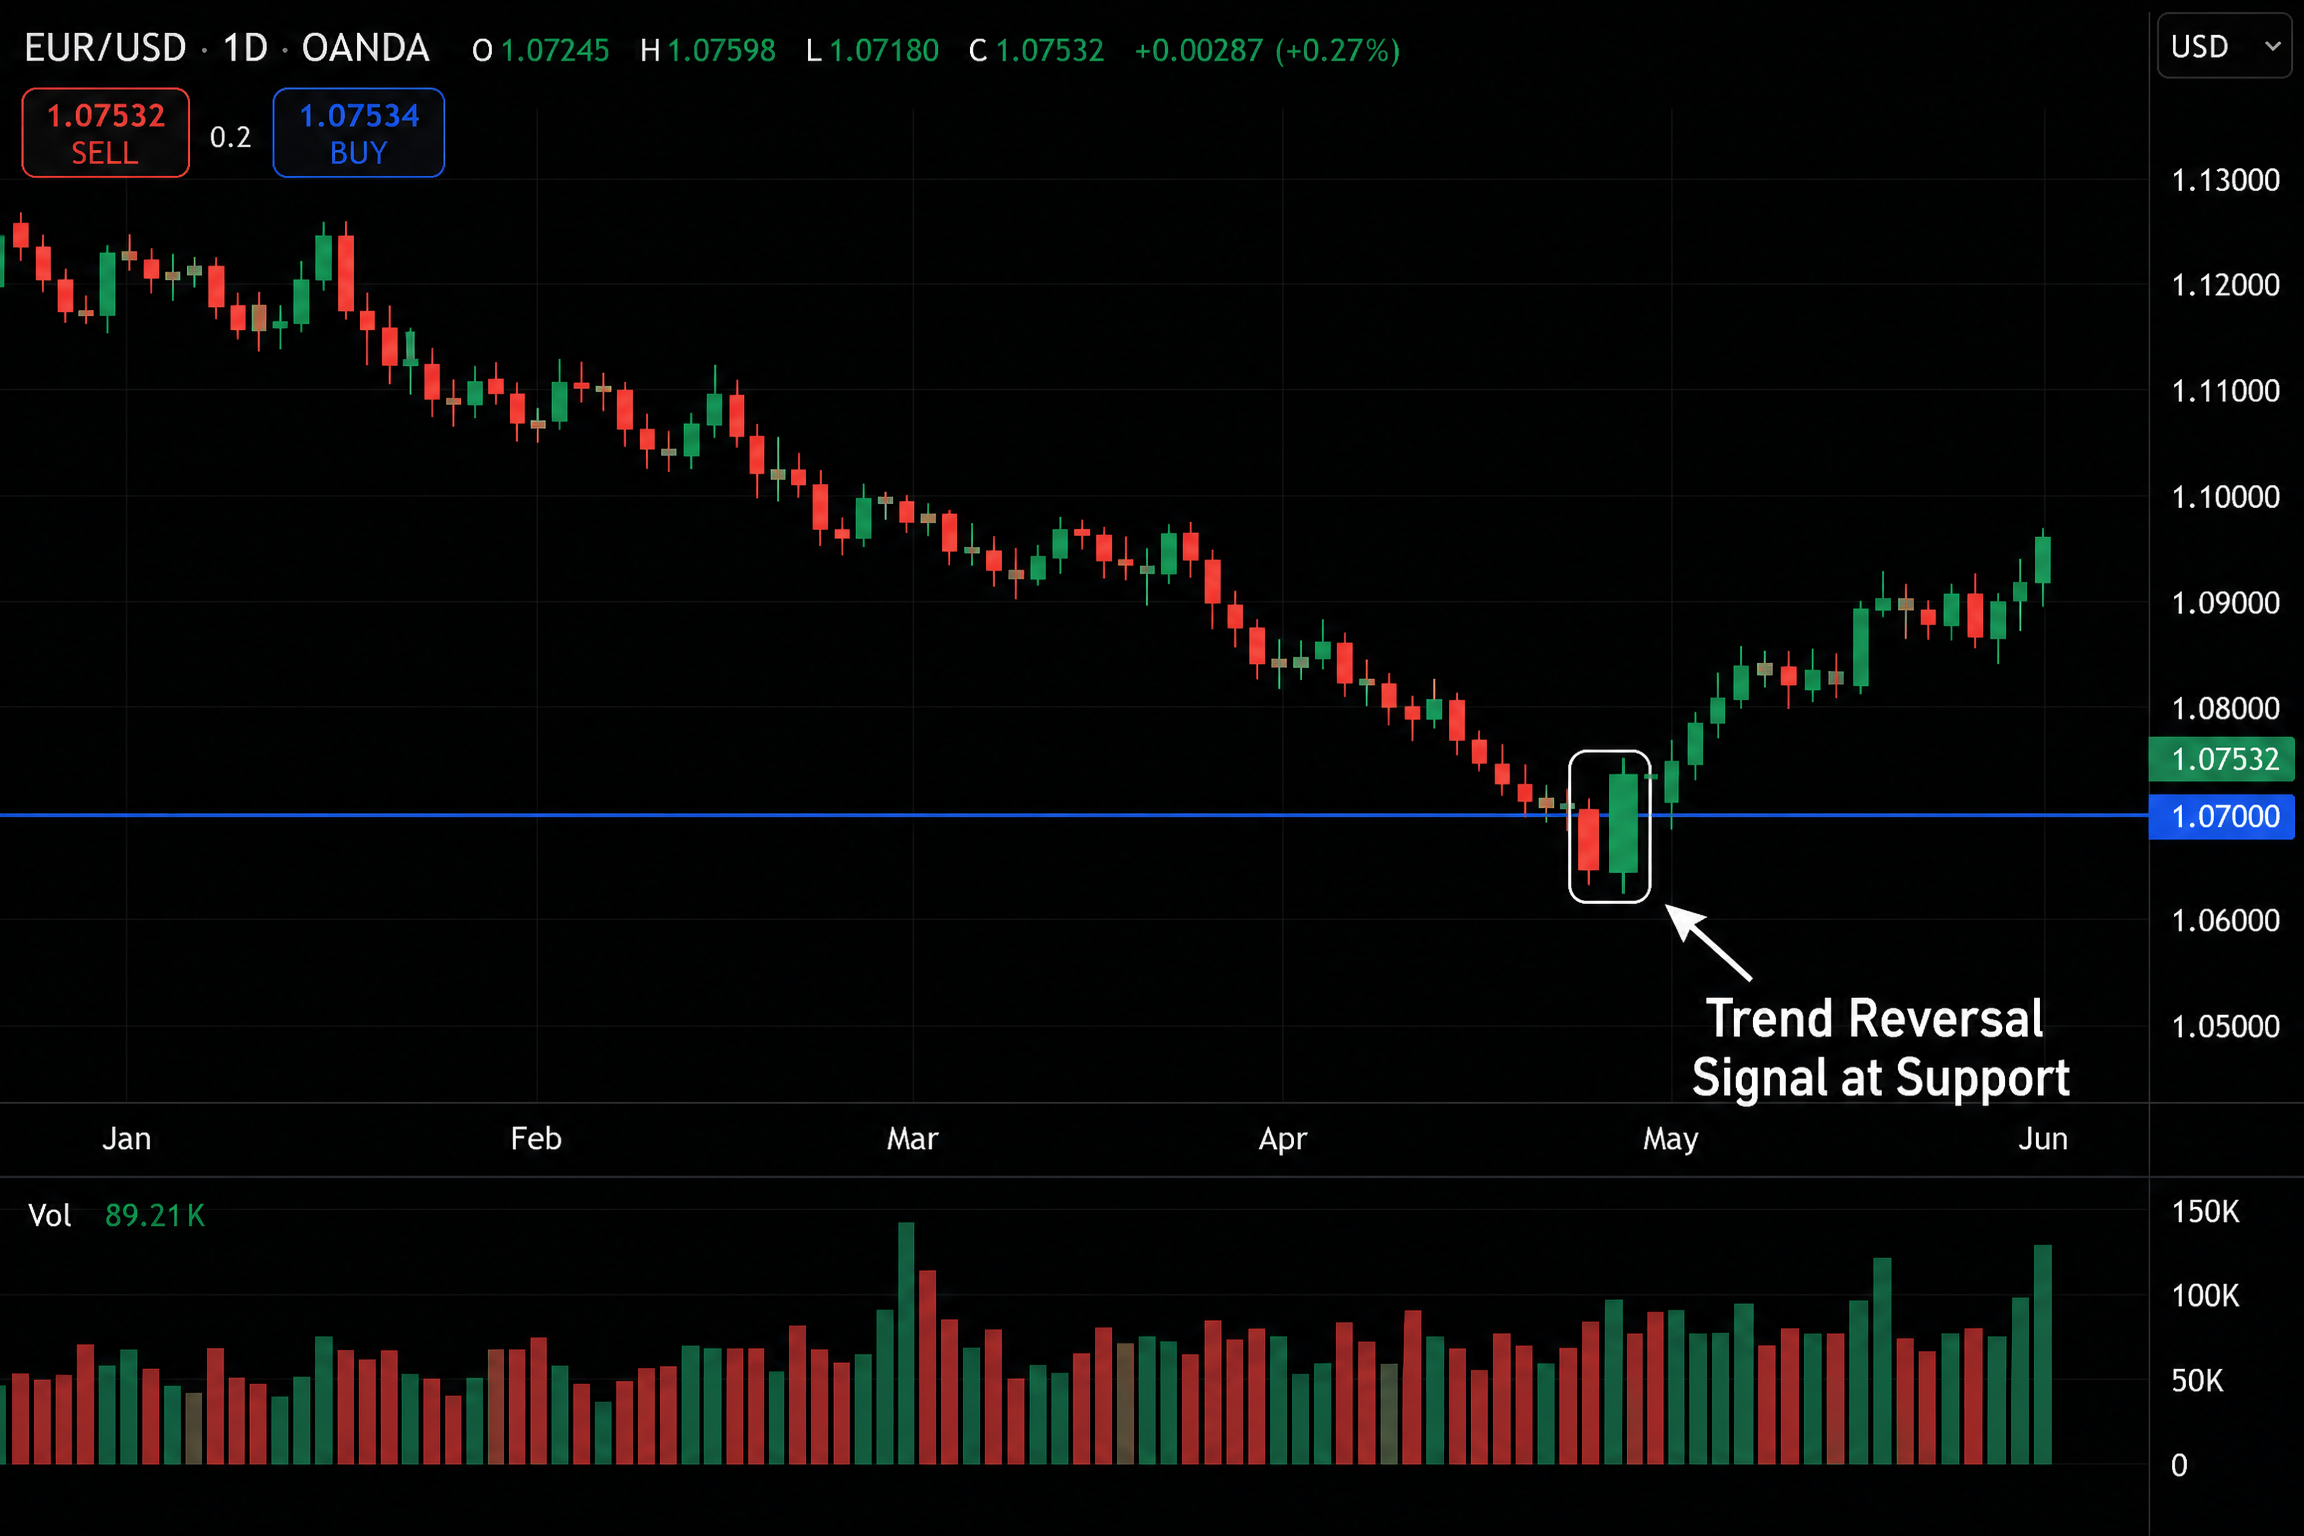
3.Breaking a resistance level (or at strong support): This adds conviction. If the engulfing candle not only forms at a swing low but also breaks above a nearby resistance, it's a much stronger signal. Conversely, if it forms right on a strong support level, that's also a big plus.
Let's look at an example. Imagine a stock has been trending down, hitting a solid support line. Then, boom! A bullish engulfing pattern appears right at that support. That's a high-probability setup I'd be interested in.
Entry, Stop Loss, and Take Profit
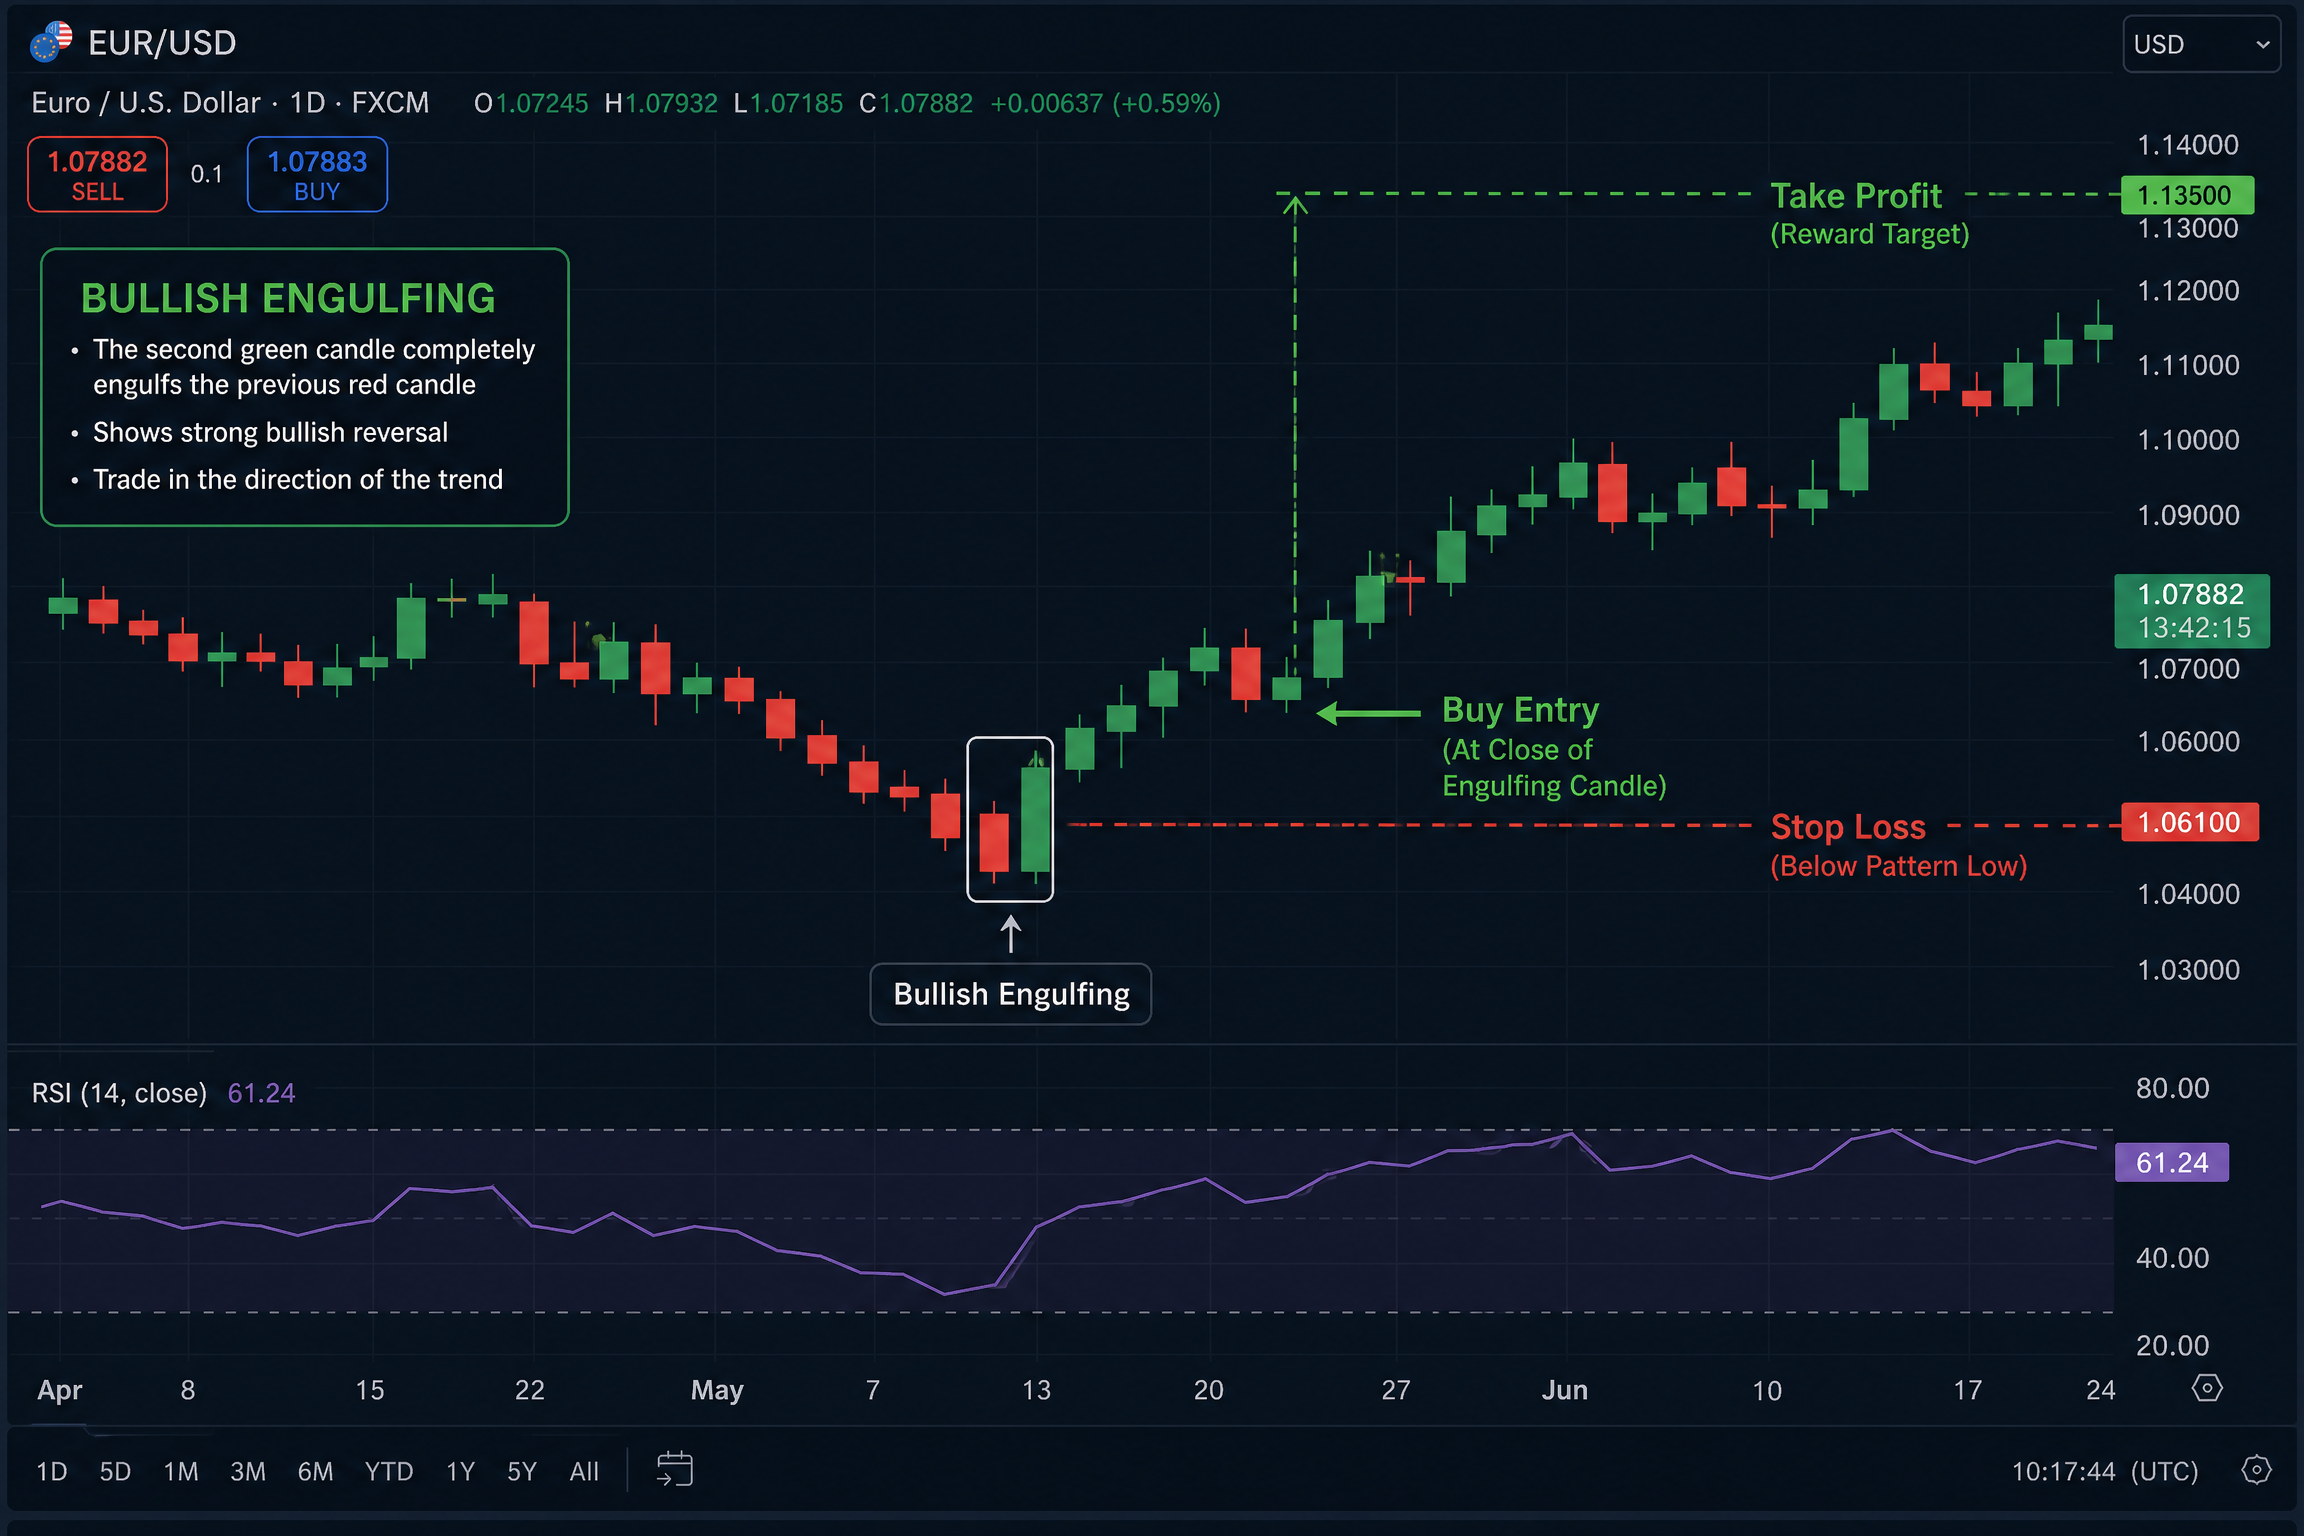
Once I spot a valid setup, my entry strategy is usually pretty straightforward. I often consider entering a long position right after the bullish engulfing candle closes, confirming the pattern.
•Entry Point: Typically, I'll enter a long trade at the close of the bullish engulfing candle.
•Stop Loss: This is crucial for risk management. I place my stop loss just below the low of the bullish engulfing candle. This way, if the market decides to go against me, my losses are limited.
•Take Profit: For profit targets, I often look for previous resistance levels or use a fixed risk-to-reward ratio, like 1:2 or 1:3. This means if I'm risking $100, I'm aiming to make $200 or $300.
The 50% Retracement Entry: A Smart Move
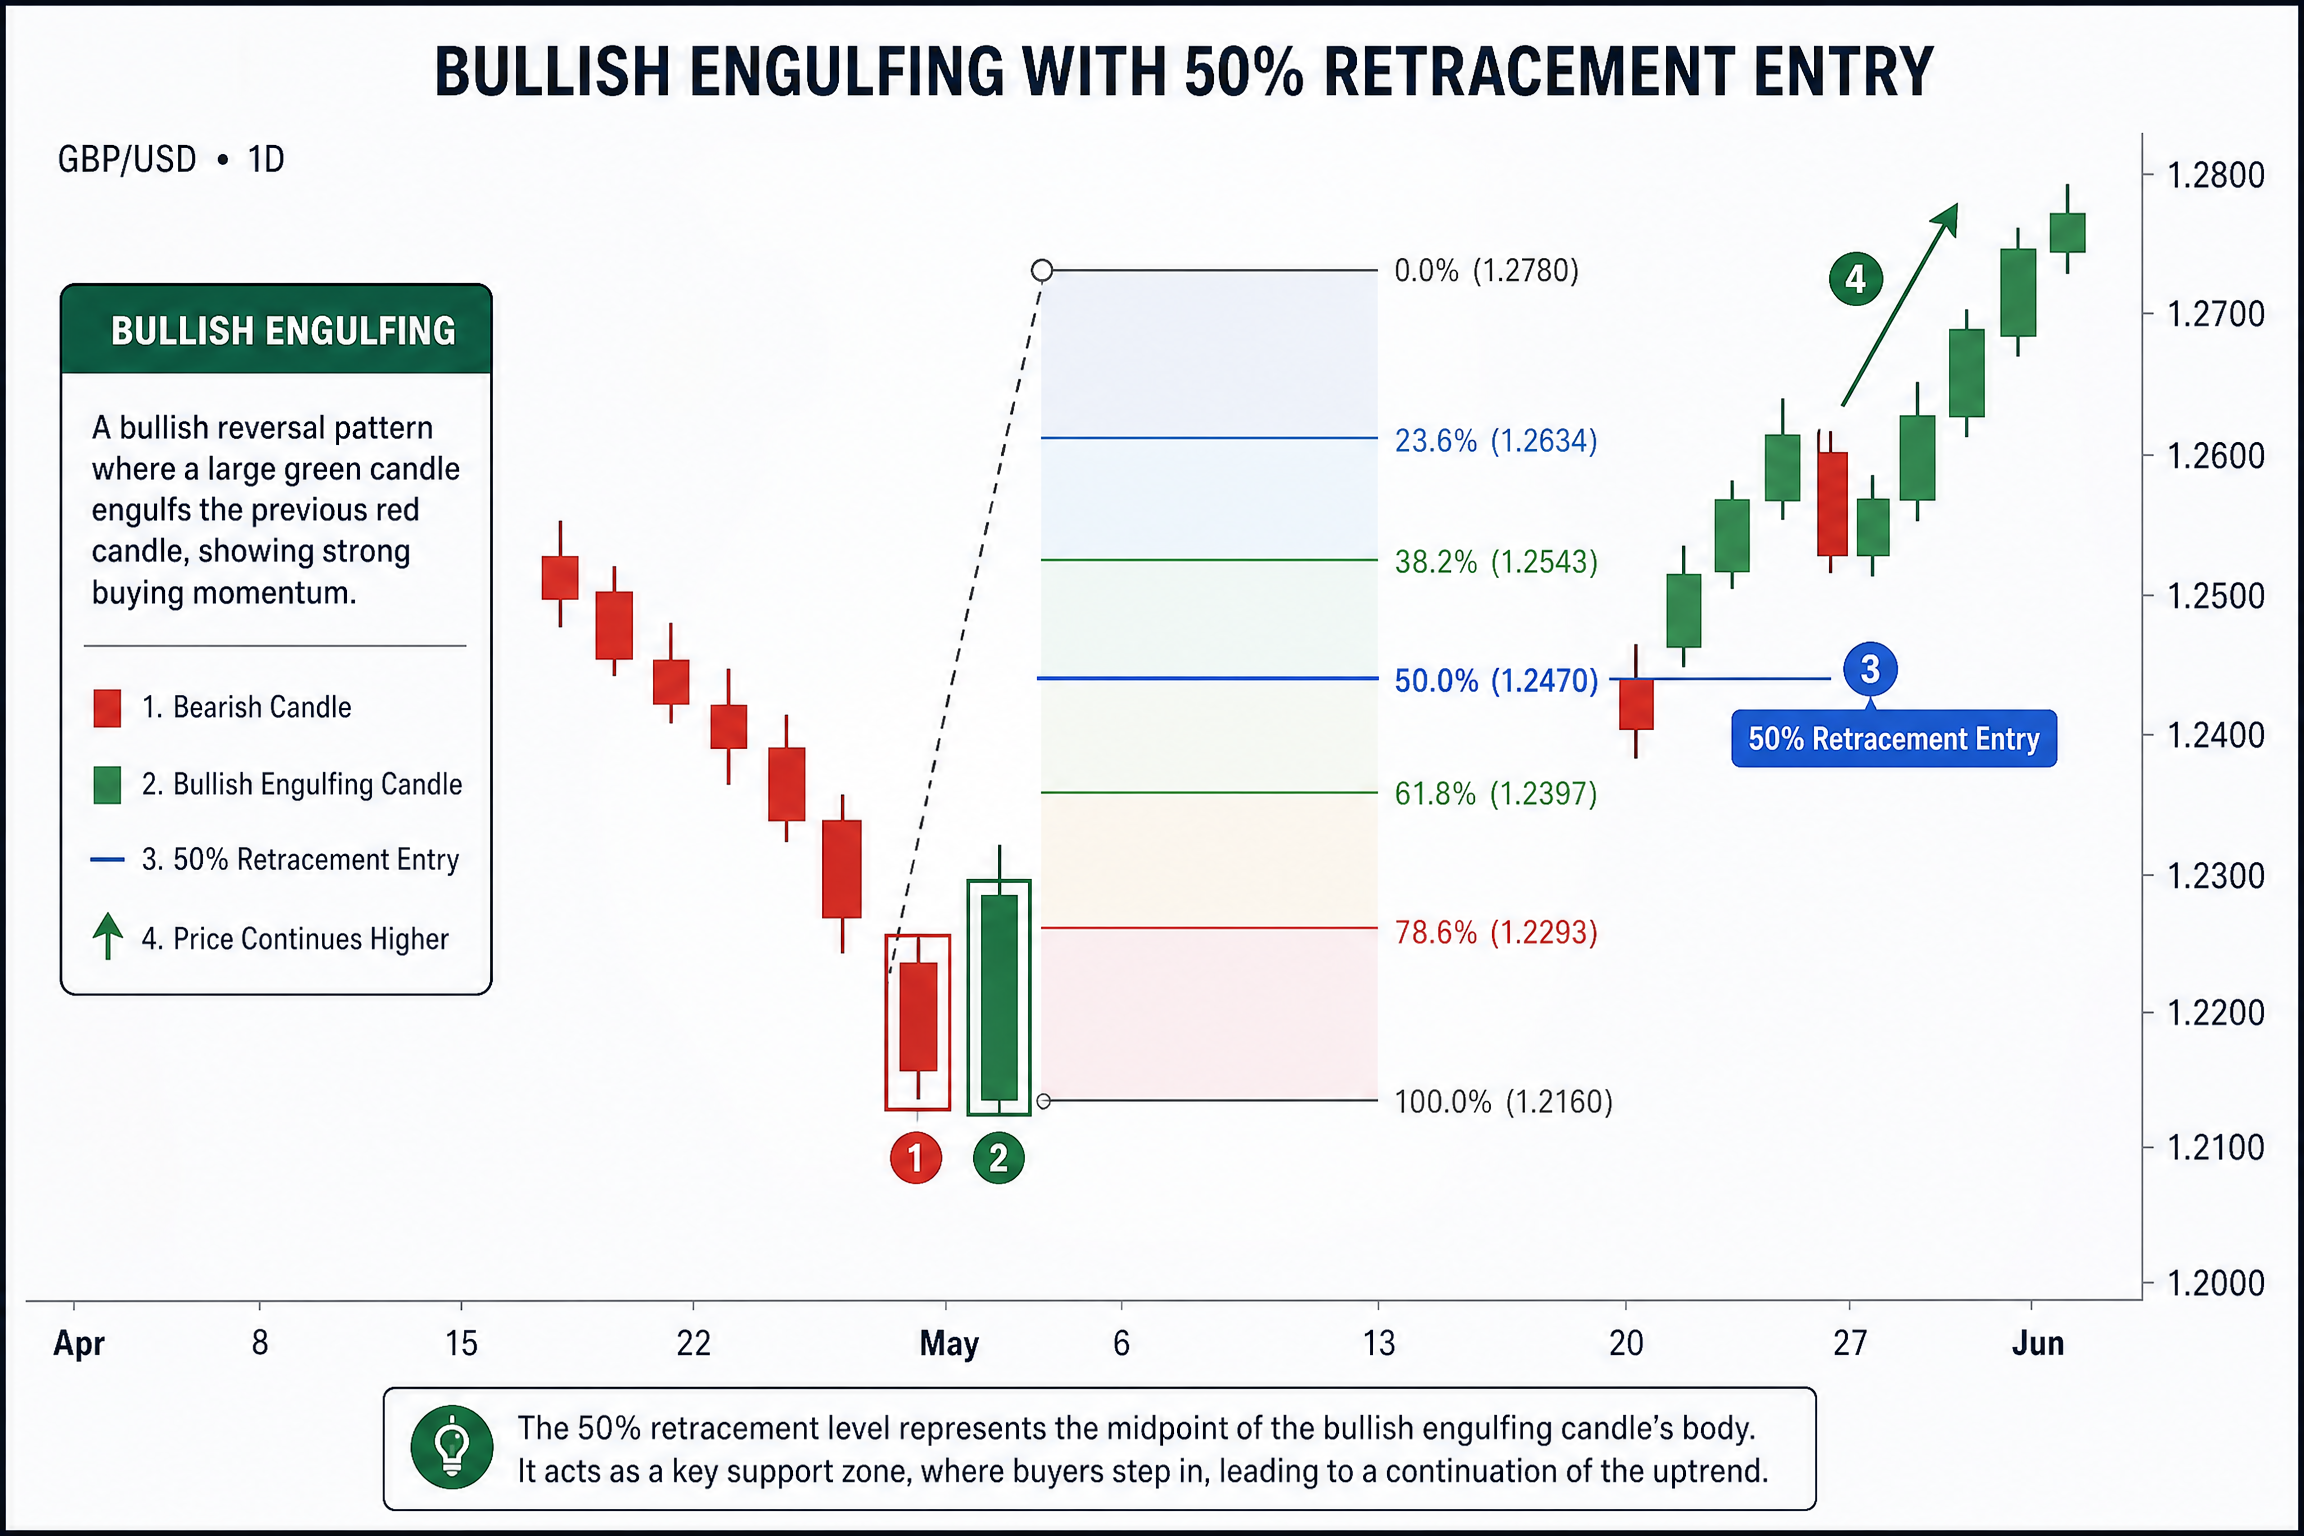
Sometimes, the bullish engulfing candle can be quite large, making your stop loss wider and potentially reducing your risk-to-reward ratio. In these cases, I often look for a 50% retracement entry.
This means waiting for the price to pull back to the 50% level of the bullish engulfing candle before entering. It allows for a tighter stop loss and a better risk-to-reward ratio, but it also means you might miss the trade if the price doesn't retrace.
I use the Fibonacci retracement tool to find this 50% level, drawing it from the low to the high of the engulfing candle. If the price pulls back to this level and shows signs of bouncing, it can be a fantastic entry point.
What to Avoid When Trading the Bullish Engulfing Pattern
Trading isn't just about knowing what to do; it's also about knowing what not to do. Here are some common pitfalls I've learned to steer clear of:
•Trading in choppy markets: If the market is moving sideways with no clear trend, engulfing patterns can be unreliable and lead to false signals.
•Entering before the candle closes: Patience is key! Always wait for the candle to fully close to confirm the pattern. Don't jump the gun.
•Ignoring higher timeframe bias: A bullish engulfing pattern on a 5-minute chart against a strong daily downtrend is much riskier. Always check the bigger picture.
•Trading without context: Don't just trade every engulfing pattern you see. It needs to align with key support, a liquidity grab, or a shift in market structure to be truly powerful.
Tips to Trade Bullish Engulfing Patterns Like a Pro
Want to sharpen your edge? Here are some quick tips I'd share over coffee:
•Always wait for the engulfing candle to CLOSE. Seriously, don't rush it.
•Use it with structure: Look for trendlines, swing points, or liquidity zones. The more confirmations, the better.
•Trade during high-volume sessions: More volume means more conviction behind the move.
•Don't chase: If the price runs off after the engulfing pattern, wait for a pullback. There's always another opportunity.
•Backtest, backtest, backtest: Go through historical charts and see how these patterns played out. Build your confidence with real data.
Frequently Asked Questions (FAQs)
Q: What is the main characteristic of a Bullish Engulfing Pattern?
A: The key is that the second (bullish) candle's body completely covers or 'engulfs' the body of the first (bearish) candle. It signals a strong shift from selling to buying pressure.
Q: How reliable is the Bullish Engulfing Pattern?
A: It's quite reliable when it forms at key support levels, after a clear downtrend, and ideally with other confirming factors like increased volume. Context is crucial for its reliability.
Q: Should I only trade Bullish Engulfing Patterns on higher timeframes?
A: In my experience, patterns on higher timeframes (like daily or 4-hour charts) tend to be more reliable and produce fewer false signals compared to lower timeframes. The bigger the timeframe, the more significant the signal.
Q: What's the best way to set a stop loss for this pattern?
A: A common and effective strategy is to place your stop loss just below the low of the bullish engulfing candle. This protects your capital if the reversal fails.
Q: Can a Bullish Engulfing Pattern fail?
A: Yes, like any pattern, it can fail. That's why combining it with other confirmations (support levels, higher timeframe analysis) and always using a stop loss is essential. No pattern is 100% foolproof.
So, there you have it. The Bullish Engulfing Pattern is a fantastic tool to add to your trading arsenal, helping you spot those early trend reversals. Just remember to use it wisely, always with proper risk management, and never as your only signal.
This article is for informational purposes only and is not financial advice. Trading involves risk, and you should consult with a qualified financial professional before making any investment decisions.


No comments:
Post a Comment