: Unlock Your Edge") |
Ever stare at charts, feeling like the market’s playing a cruel joke on you? You see a setup, jump in, and then BAM! Price whipsaws, stops you out, and then goes exactly where you thought it would. Sound familiar? It’s enough to make you want to throw your monitor out the window.
But what if I told you there’s a way to understand why that happens? To see the manipulation before it crushes your account? That’s where the CRT Day Trading Strategy (Candle Range Theory) comes into play. This isn’t some magic bullet, but it’s a powerful lens to view market dynamics, especially if you’re tired of being liquidity for the big players.
What is CRT Day Trading Strategy (Candle Range Theory)? Your Blueprint for Market Manipulation
Let’s cut the fluff. The Candle Range Theory, or CRT, is about understanding how institutional money moves. It’s not about predicting the future with a crystal ball.
It’s about recognizing patterns of accumulation, manipulation, and distribution (AMD) within a single candlestick’s range. Think of it as Wyckoff’s principles, but condensed and supercharged for day trading and scalping.
Every single candle on a higher timeframe – say, a 4-hour or 1-hour chart – represents a battleground. Within that battleground, on lower timeframes (like 5-minute or 15-minute), price isn’t just randomly bouncing around.
It’s doing something very specific: hunting liquidity. It’s going after those stop losses and pending orders that retail traders like us often place at obvious highs and lows.
The "Why" Behind CRT: Liquidity and Manipulation
Why does this even matter? Because large operators, the whales of the market, need massive amounts of liquidity to fill their orders without moving the market against themselves. They can’t just click a button and buy a million shares without causing a huge spike.
So, what do they do? They engineer moves to trigger your stops. They push price just beyond a clear high or low, grab all those waiting orders, and then reverse course. This isn’t personal; it’s just business.
CRT helps you identify these liquidity grabs. It’s about understanding that often, a breakout isn’t a true breakout, but a trap. It’s a sweep of stops before the real move begins in the opposite direction.
This concept isn’t new. Richard Wyckoff talked about Springs and Upthrusts almost a century ago. Linda Raschke popularized "Turtle Soup" in the 90s, trading against false breakouts. And then Michael Huddleston, the Inner Circle Trader (ICT), modernized these ideas for the digital age.
CRT is the latest evolution, simplifying these powerful concepts into a repeatable framework for individual candles. It’s about recognizing that mini-AMD cycle within each higher-timeframe candle.
If you are also interested in passive income, check out these 4 Penny Stocks That Pay Regular Dividends.
The AMD Cycle in CRT: Accumulation, Manipulation, Distribution
At the core of CRT is the AMD cycle. This is what’s happening inside that higher-timeframe candle, compressed and playing out on your lower timeframe chart.
•Accumulation (A): Price consolidates. It moves sideways, building energy. Institutions are quietly building their positions here, without tipping their hand.
•Manipulation (M): This is the liquidity hunt. Price briefly breaks one extreme of the range – either the high or the low – to trigger stops. This is your classic "fakeout" or "stop hunt." It’s designed to get you out of your position or lure you into the wrong direction.
•Distribution (D): After the manipulation, the real move begins. Price reverses sharply and heads towards the opposite extreme of the initial range. This is where the institutions, having collected their liquidity, push price in their intended direction.
Think of it like this: The market needs fuel (liquidity) to move. The manipulation phase is when it goes to the gas station. Once fueled up, it drives off in the direction it really wants to go.
How CRT Day Trading Strategy Works: Your Step-by-Step Guide
Alright, so how do you actually use this? It’s a clear, repeatable process. No guesswork, just observation and execution.
1. Identify Your Reference Candle and Its Range
First, you need a higher-timeframe candle. This could be a 1-hour, 4-hour, or even daily candle. This candle sets your "range." Mark its high and its low. These are your CRT-High and CRT-Low. This range is where all the action is going to happen.
2. Wait for the Liquidation (The Sweep)
Now, you wait. You’re looking for the next candle, or series of candles, to break either the CRT-High or the CRT-Low. This is the manipulation phase. Price is going to sweep one of those levels, grabbing all the stops that are sitting there.
3. Confirm the Return to Range (The Re-entry)
This is crucial. A liquidation alone isn’t enough. The candle that performed the sweep must close back inside the original reference candle’s range. If it breaks out and keeps going, that’s a genuine breakout, not a CRT setup. The re-entry confirms that the sweep was indeed manipulation.
4. Project Towards the Opposite Extreme (The Target)
Once you have that confirmed re-entry, your target becomes the opposite extreme of the original reference candle’s range. If price swept the low and re-entered, you’re looking for it to go to the CRT-High. If it swept the high and re-entered, you’re targeting the CRT-Low.
Let’s visualize this. It makes a lot more sense when you see it.
|
| Image 1: Bullish CRT Model - Price sweeps below the H4 low, then reverses sharply to target the H4 high |
Here, you see price dipping below the H4 low, taking out those sell stops, and then quickly reversing. That reversal, often accompanied by a Market Structure Shift (MSS) on the lower timeframe, signals the real move is about to begin.
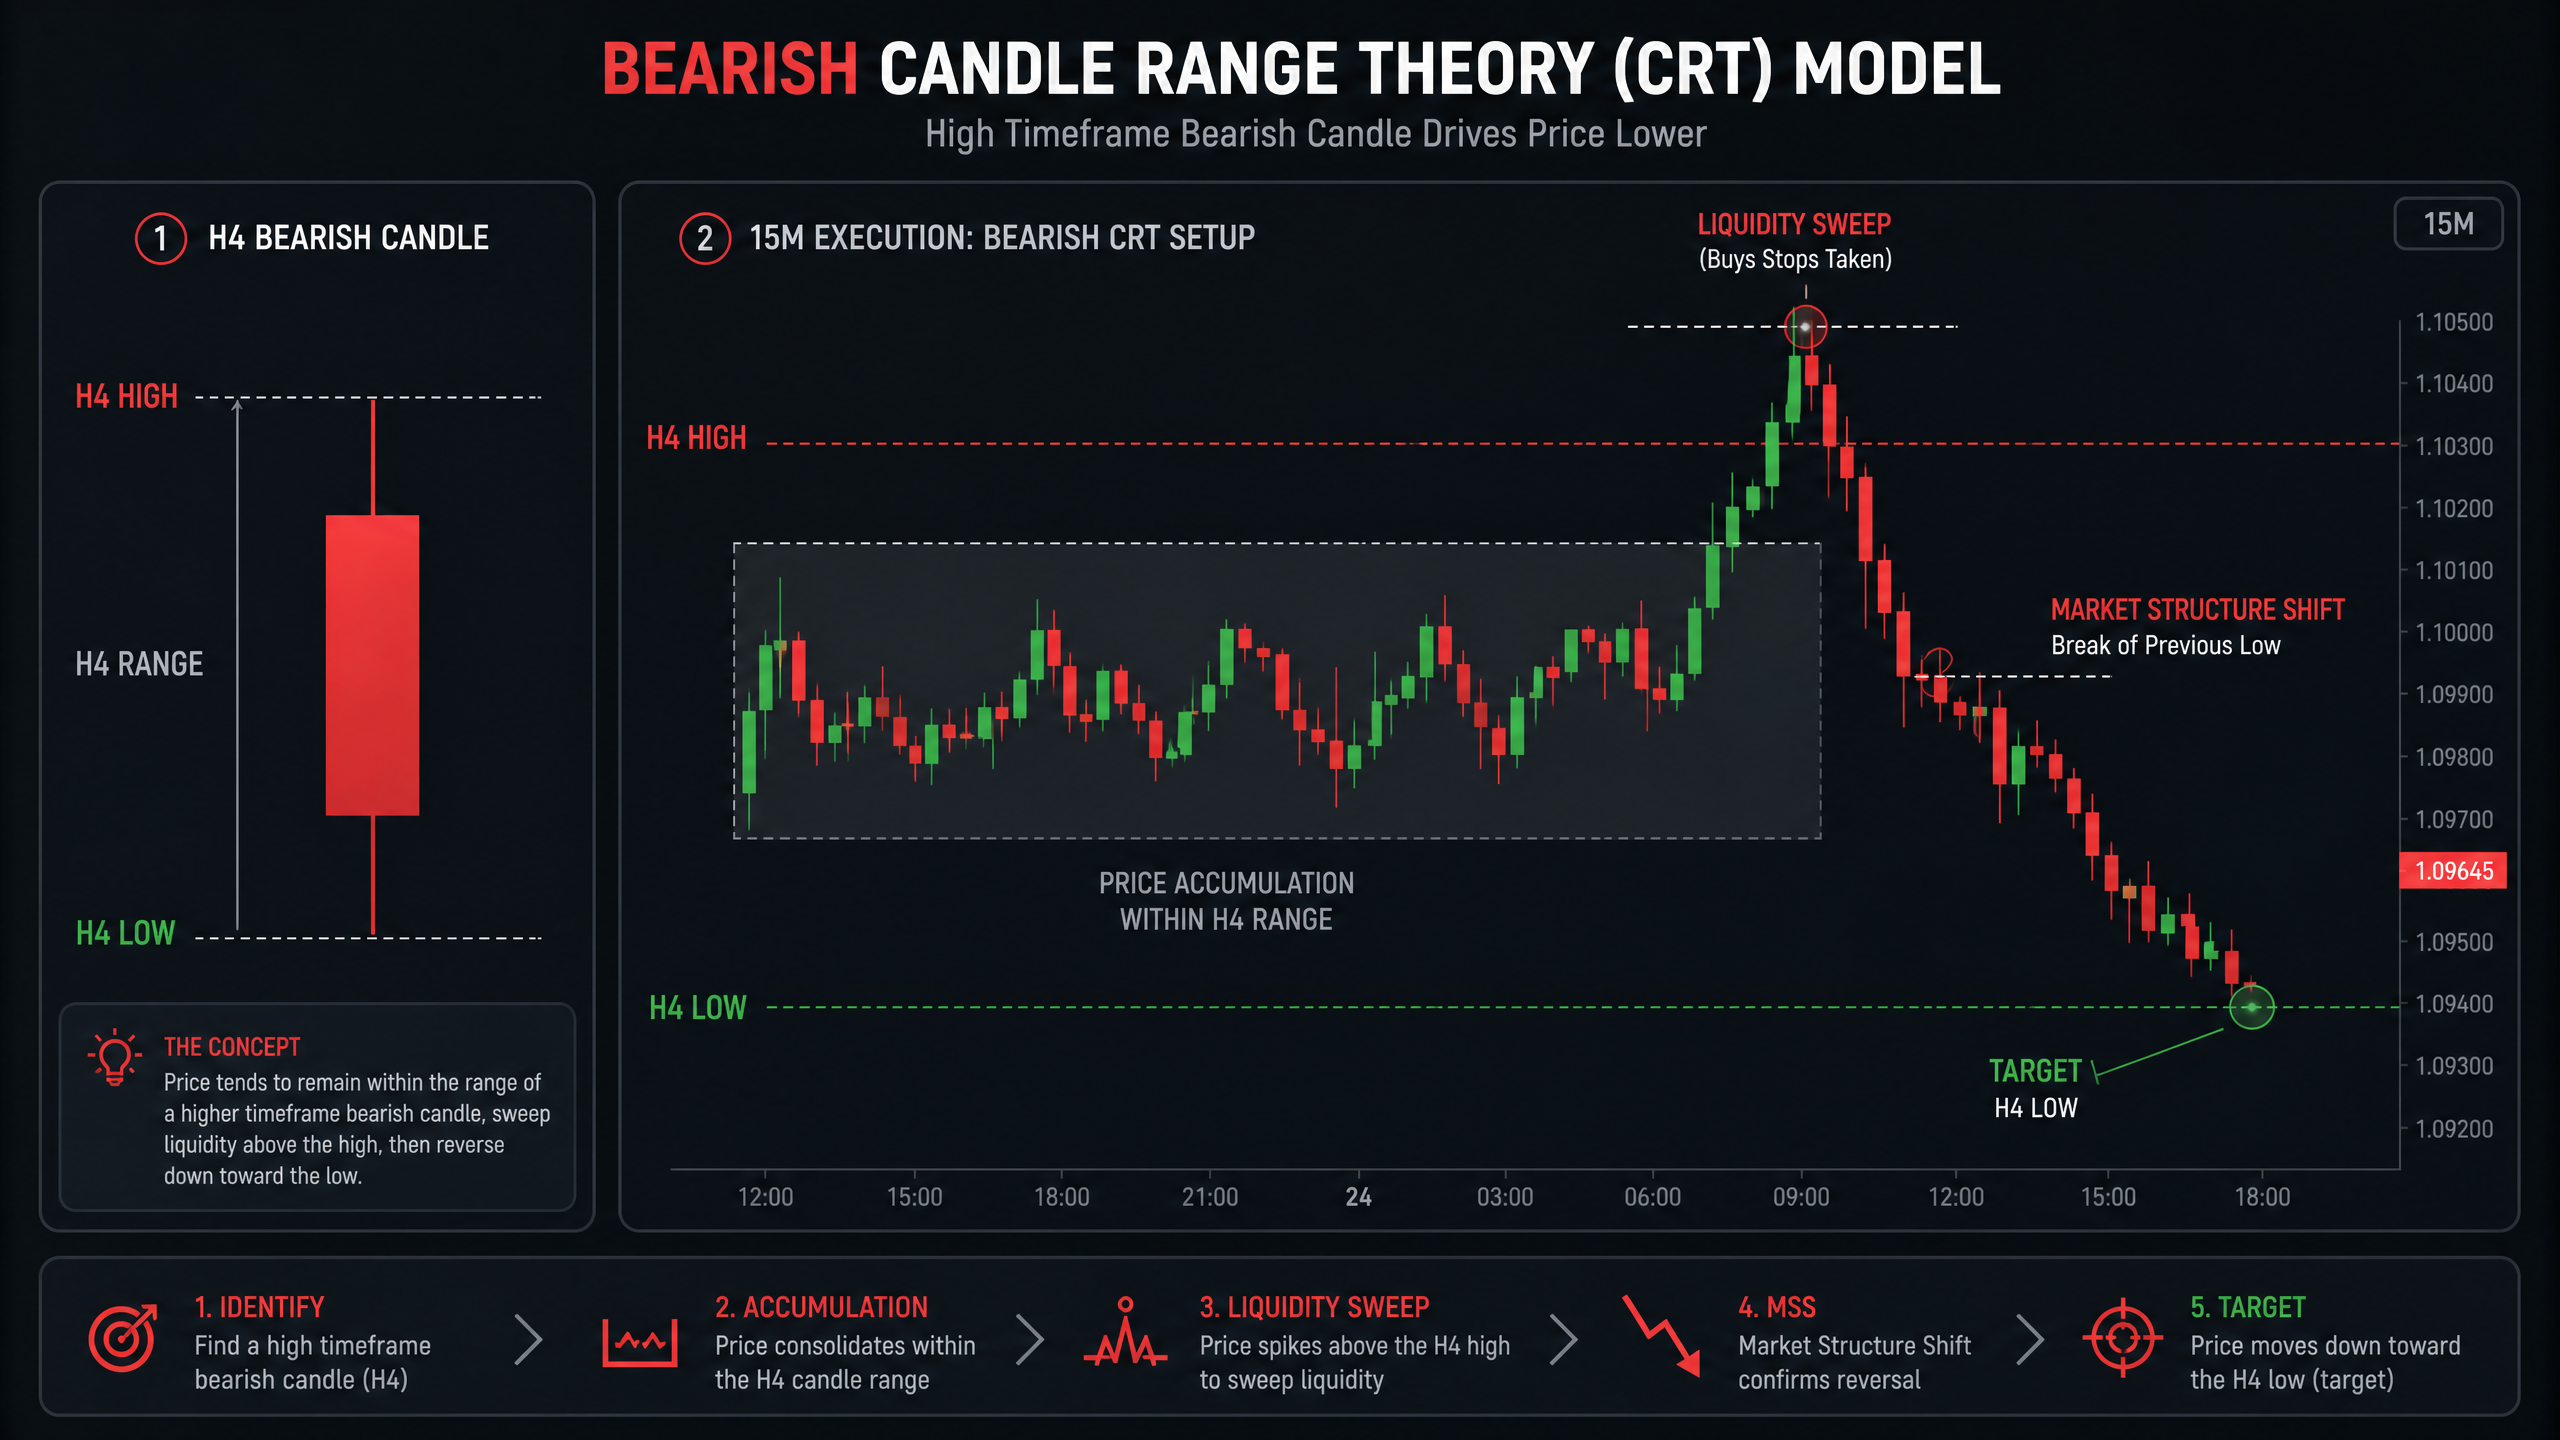 |
| Image 2: Bearish CRT Model - Price sweeps above the H4 high, then reverses sharply to target the H4 low. |
And here’s the inverse. Price pushes above the H4 high, grabbing buy stops, only to then crash back down. The key is that swift reversal after the liquidity grab.
The 3-Candle CRT Rule: Your Confirmation Checklist
To make sure you’re not jumping the gun, there’s a simple 3-candle rule for confirmation. This is your checklist to ensure you’re seeing a valid CRT setup.
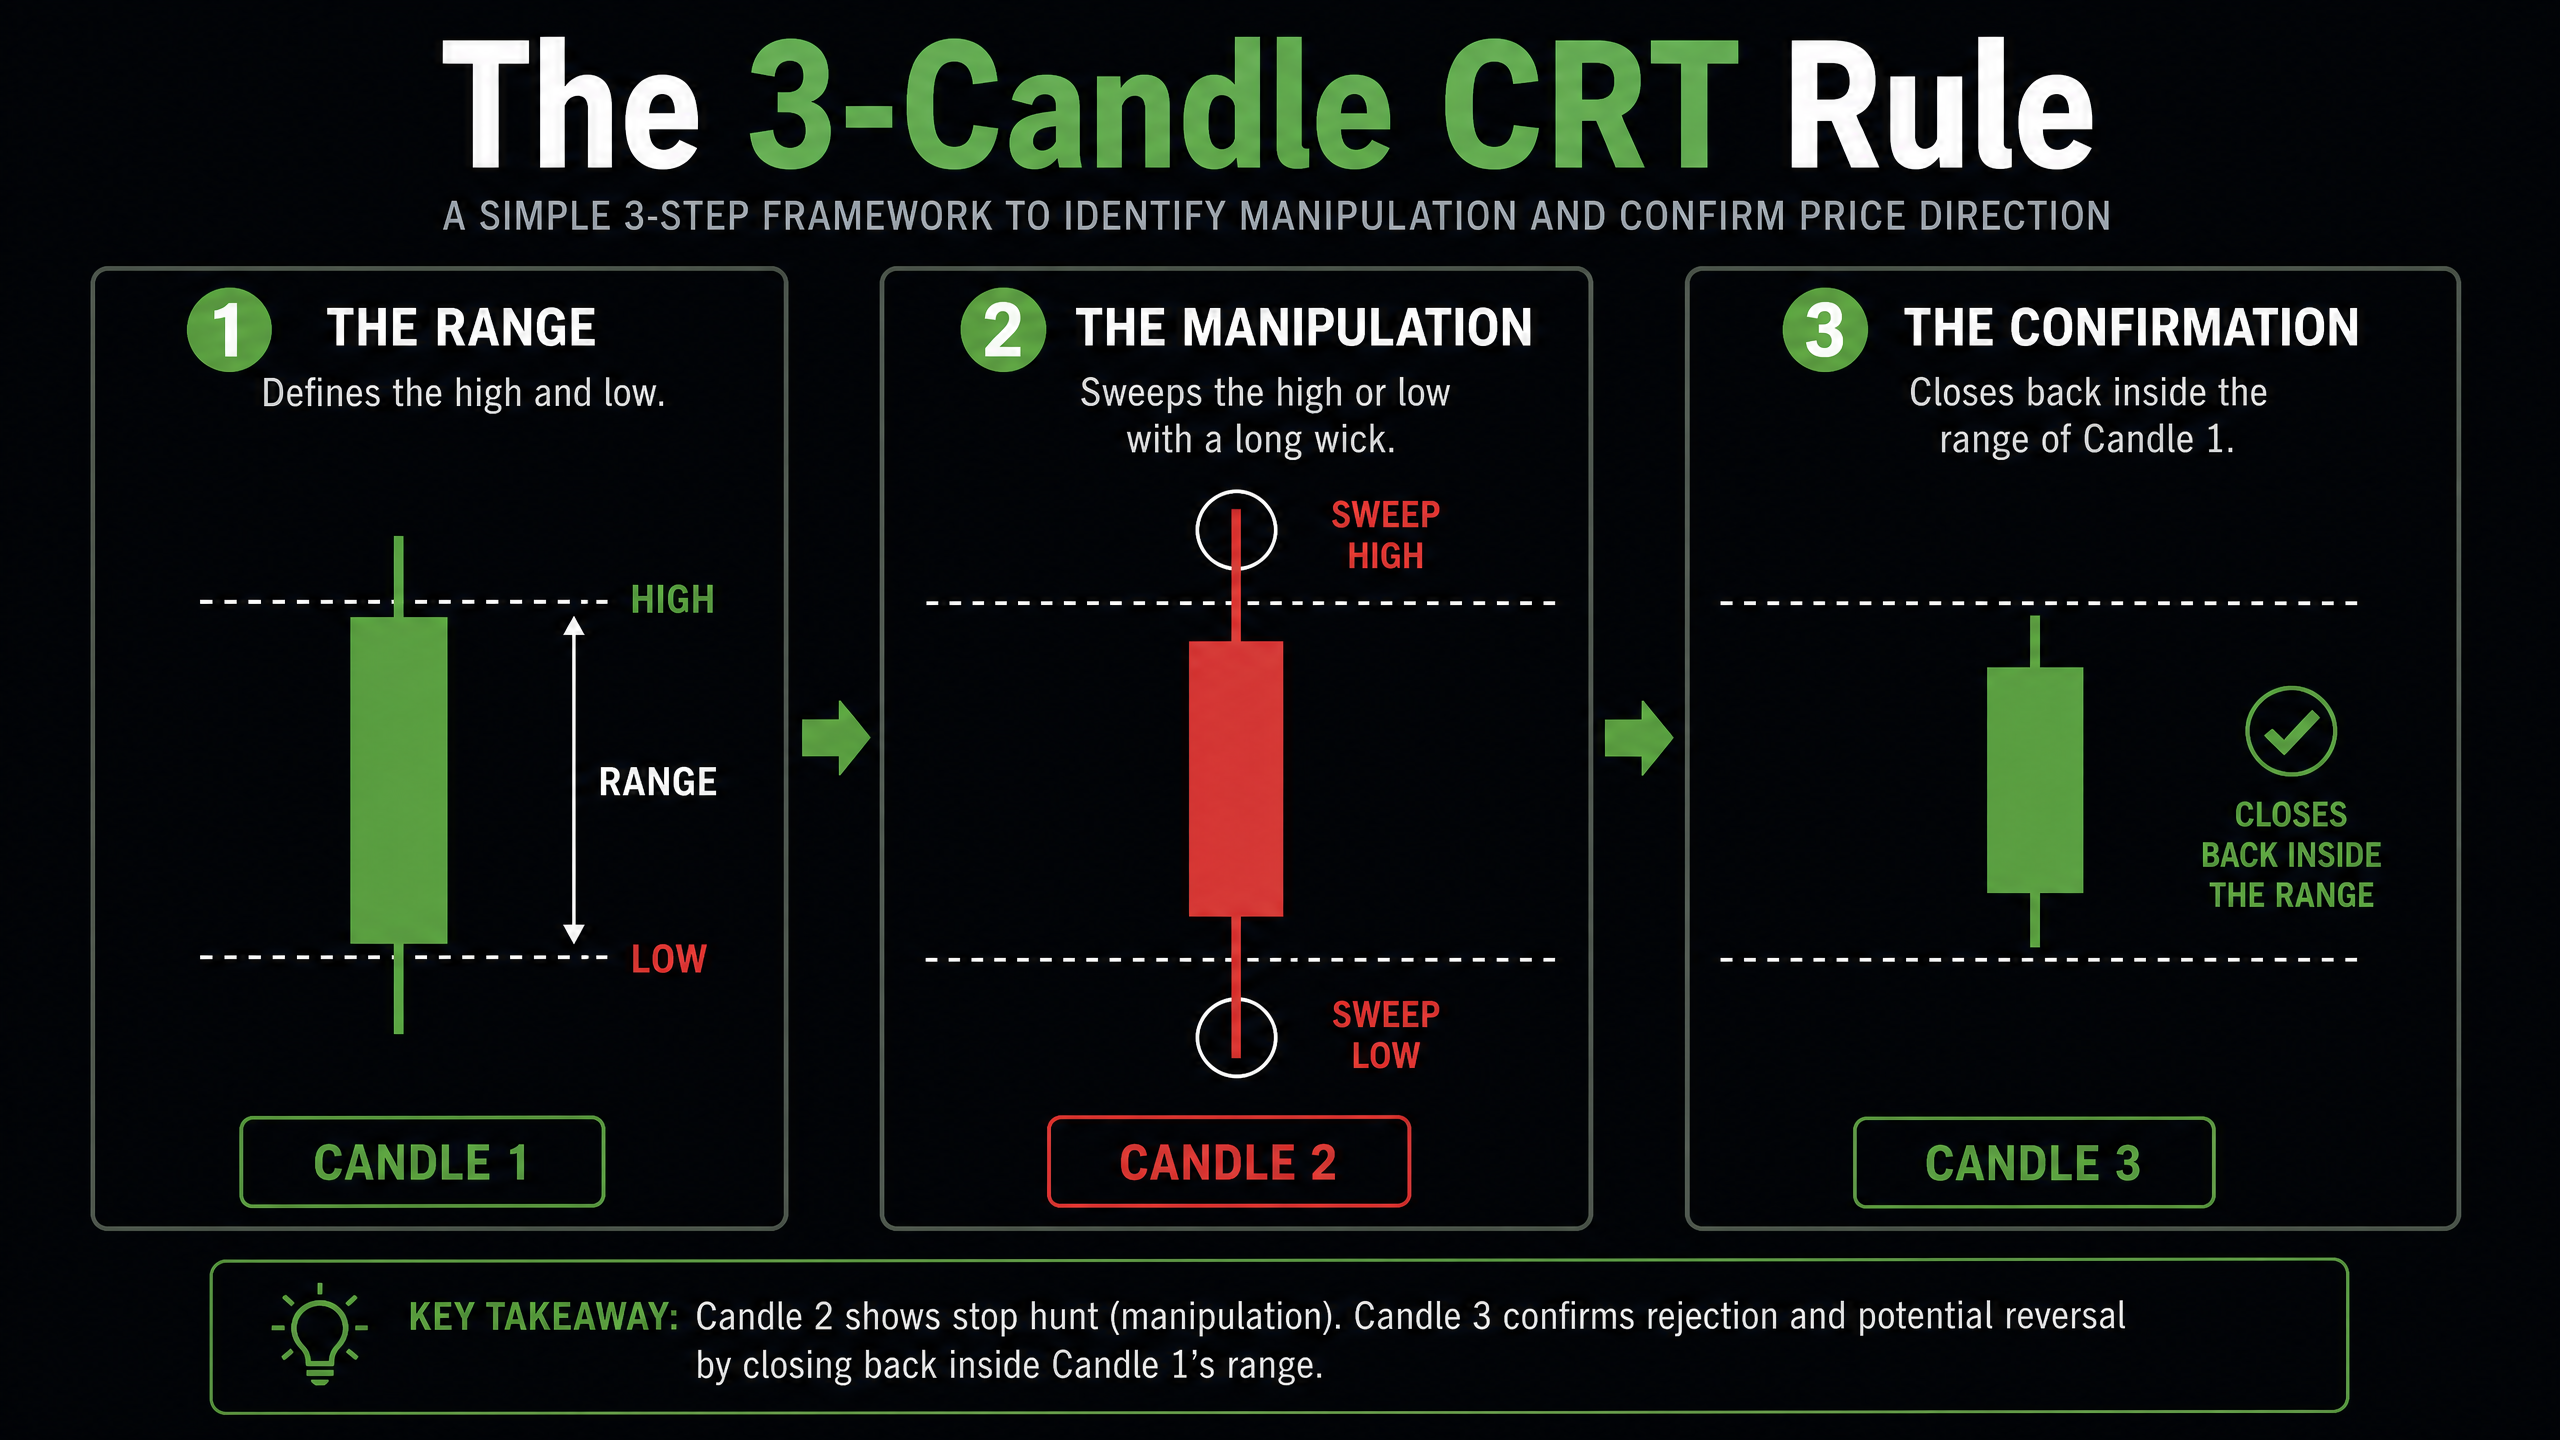 |
Image 3: The 3-Candle CRT Rule - A simple sequence to confirm manipulation and reversal. |
•Candle 1: The Range. This is your reference candle. It establishes the high and low that will be targeted for liquidity.
•Candle 2: The Manipulation. This candle sweeps one of the extremes of Candle 1. It might have a long wick extending beyond Candle 1’s high or low.
•Candle 3: The Confirmation. This is the money candle. It must close back inside the range of Candle 1. If it doesn’t, it’s not a valid CRT setup. This close confirms the manipulation was indeed a trap.
Don’t make the rookie mistake of entering on Candle 2. That’s premature. Wait for Candle 3’s close. Patience pays, especially in day trading.
High-Probability CRT Setups: Stacking the Odds in Your Favor
CRT is powerful on its own, but you can supercharge it by combining it with other high-probability concepts. Think of it as adding layers of confirmation.
•Kill Zones: Many experienced traders find CRT setups are most potent during specific "Kill Zones" – periods of high institutional activity, like the London or New York trading sessions. This is when the algorithms are most active, and the liquidity sweeps are most pronounced.
•Previous Session High/Low: If your CRT-High or CRT-Low aligns with a previous day’s high or low, or a previous session’s high or low, that’s a huge confluence. These are obvious liquidity pools that institutions love to target.
•Order Blocks & Fair Value Gaps: After a confirmed CRT manipulation and Market Structure Shift (MSS) on the lower timeframe, look for entries on a retest into an Order Block or a Fair Value Gap. These are areas where institutional orders are likely to be filled, offering precise entry points.
Remember, the goal isn’t to trade every single CRT setup. It’s to trade the best ones. The ones with multiple layers of confluence. This is how you build an edge.
Common Mistakes When Trading CRT: Don’t Be That Guy
Look, everyone makes mistakes. But with CRT, some are more common than others. Avoid these pitfalls:
•Trading in the Middle of Nowhere: CRT works best when the reference candle closes at a significant support or resistance level. Don’t try to force a setup in the middle of a choppy range. Price needs a reason to manipulate, and that reason is usually a key level.
•Ignoring the Close Confirmation: This is a big one. A wick that sweeps a level but doesn’t close back inside the range? That’s not a CRT. That’s often just continuation. The close inside the range is your green light.
•No Market Structure Shift (MSS): After the sweep and re-entry, you need to see a clear shift in market structure on your lower timeframe. This confirms that the internal order flow has changed. Without it, you’re just guessing.
•Over-Leveraging: You found a great setup, awesome. But don’t bet the farm. Even the best strategies have losing trades. Manage your risk. If you’re looking for tools to help with risk management, check out this post on Best Day Trading Apps in 2026 – it can help you find platforms with robust features.
•Not Understanding the Higher Timeframe Bias: CRT is a short-term strategy, but it operates within a larger context. Always know your higher timeframe bias. Are you trying to go long into a strong downtrend? That’s swimming upstream. Sometimes, even penny stocks that pay dividends can offer insights into broader market sentiment, so keep an eye on the bigger picture.
FAQs About CRT Day Trading Strategy
Q: Is CRT only for Forex?
A: Not at all. While popular in Forex, CRT is a price action concept. It works across various markets: stocks, indices, commodities, and crypto. If it has candlesticks and liquidity, CRT can be applied. I’ve personally seen it work on everything from major currency pairs to futures contracts.
Q: What timeframe is best for CRT?
A: CRT is timeframe-agnostic, meaning it works on any timeframe. However, for day trading, many traders use higher timeframes like H1 or H4 for the reference candle, and then drop down to M5 or M15 for entry confirmation. The daily candle can even be used for swing trading CRT setups.
Q: How does CRT relate to ICT concepts?
A: CRT is heavily derived from ICT (Inner Circle Trader) concepts. It builds upon ideas like liquidity sweeps, market structure shifts, and the Power of 3 (accumulation, manipulation, distribution). While not an original ICT concept, it’s a simplification and application of those core principles to individual candles.
Q: Can I automate CRT?
A: Theoretically, yes. Any rule-based strategy can be automated. However, the nuances of identifying true market structure shifts and the "feel" for liquidity can be hard to code. It’s often best used as a discretionary tool. If you’re interested in tracking your trades and performance, a good stock portfolio tracker free online can be invaluable, whether you’re trading manually or with automation.
Q: What’s the biggest challenge with CRT?
A: Patience and discipline. Waiting for the full 3-candle confirmation, not chasing moves, and sticking to your risk management rules. It’s easy to get excited and jump in early, but that’s where most traders lose money.
Final Thoughts on CRT Day Trading Strategy
The CRT Day Trading Strategy (Candle Range Theory) isn’t a magic formula, but it’s a powerful framework for understanding market mechanics. It helps you see beyond the surface, recognize institutional manipulation, and position yourself on the right side of the move.
It demands discipline, patience, and a keen eye for detail. Master it, and you’ll have a significant edge in the markets.
Disclaimer: This article is for informational and educational purposes only and does not constitute financial advice. Trading involves substantial risk, and you should consult with a qualified financial professional before making any investment decisions.


No comments:
Post a Comment