Ever stared at a trading chart, feeling that knot in your stomach, wondering if the uptrend you're riding is about to crash and burn? We've all been there. It's tough to know when to hold 'em and when to fold 'em, especially when the market feels like it's on a rocket ship.
But what if there was a simple visual cue, a little heads-up from the market itself, telling you that things might be about to turn? That's where the Candlestick Analysis: Shooting Star Pattern comes into play. Think of it as the market whispering, "Hey, maybe slow down a bit."
What Exactly is a Shooting Star Candlestick?
Imagine you're at a coffee shop, chatting about charts. I'd tell you that a Shooting Star is a single candlestick pattern that often pops up after a strong bullish run. It's a bearish reversal pattern, meaning it suggests the price might be heading down after an uptrend.
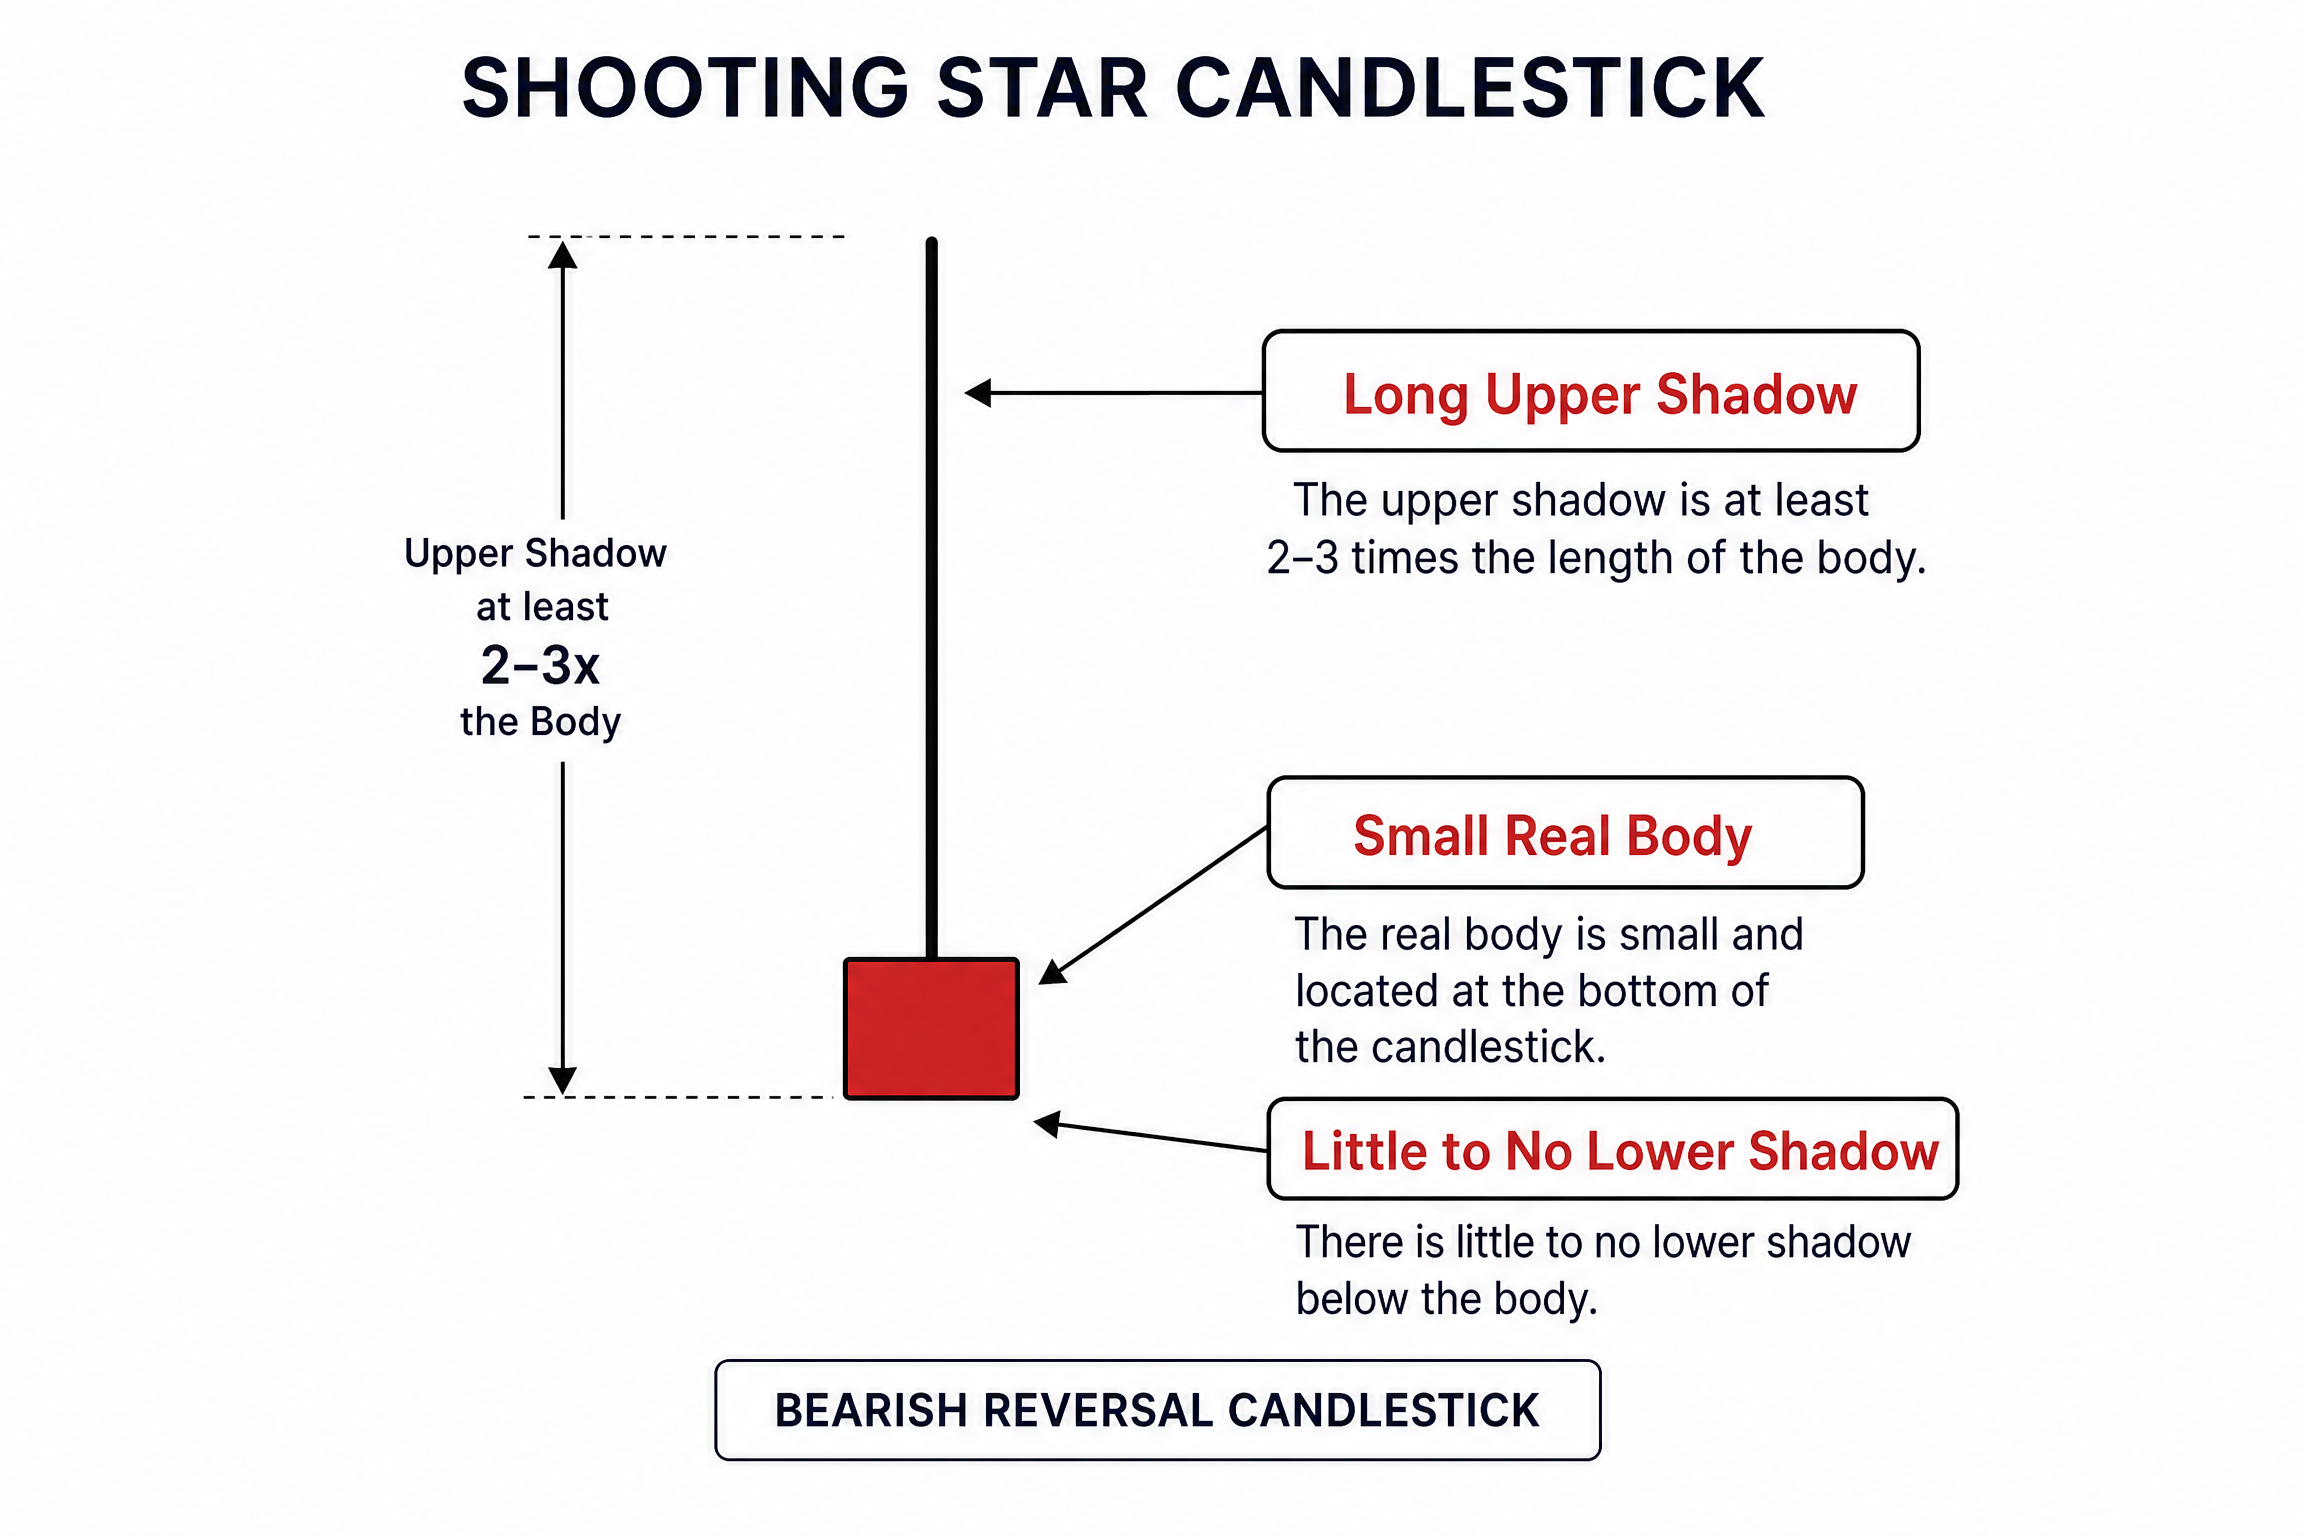
It looks a bit like a lollipop or, well, a shooting star. It has a small body, a long upper wick (or shadow), and little to no lower wick. The color of the body doesn't really matter much, though a red (bearish) body can add a little extra conviction to the signal.
You can check this trading patterns cheatsheet for more setups.
The Anatomy of Our Star
Let's break down its key features:
•Small Real Body: This is the chunky part of the candle. It's small, indicating that the opening and closing prices were pretty close to each other.
•Long Upper Shadow: This is the most distinctive feature. The upper wick should be at least two to three times the length of the real body. It shows that buyers tried to push the price higher, but sellers stepped in aggressively and pushed it back down before the close.
•Little to No Lower Shadow: This tells us that once the sellers took control, they kept the price near the low of the candle, with little resistance from buyers.
Why Does the Shooting Star Matter?
When you see a Shooting Star, especially after a significant price increase, it's like the market is telling you, "We tried to go higher, but we couldn't sustain it." It signals that the buying pressure might be exhausted, and sellers are starting to take control.
It's a warning sign, a potential heads-up that the party might be over for the bulls, and the bears are getting ready to dance.
How to Spot a Shooting Star in the Wild
Spotting this pattern isn't just about seeing the shape; it's about the context. Here's what I look for:
1.An Existing Uptrend: This is crucial. A Shooting Star needs an uptrend to reverse. If it appears during a downtrend, it's something else entirely (like an Inverted Hammer, which is bullish – confusing, right?).
IF YOU WANT TO TAKE YOUR STOCK INVESTMENT TO THE NEXT LEVEL, READ MY CAPITALIST EXPLOITS REVIEW HERE
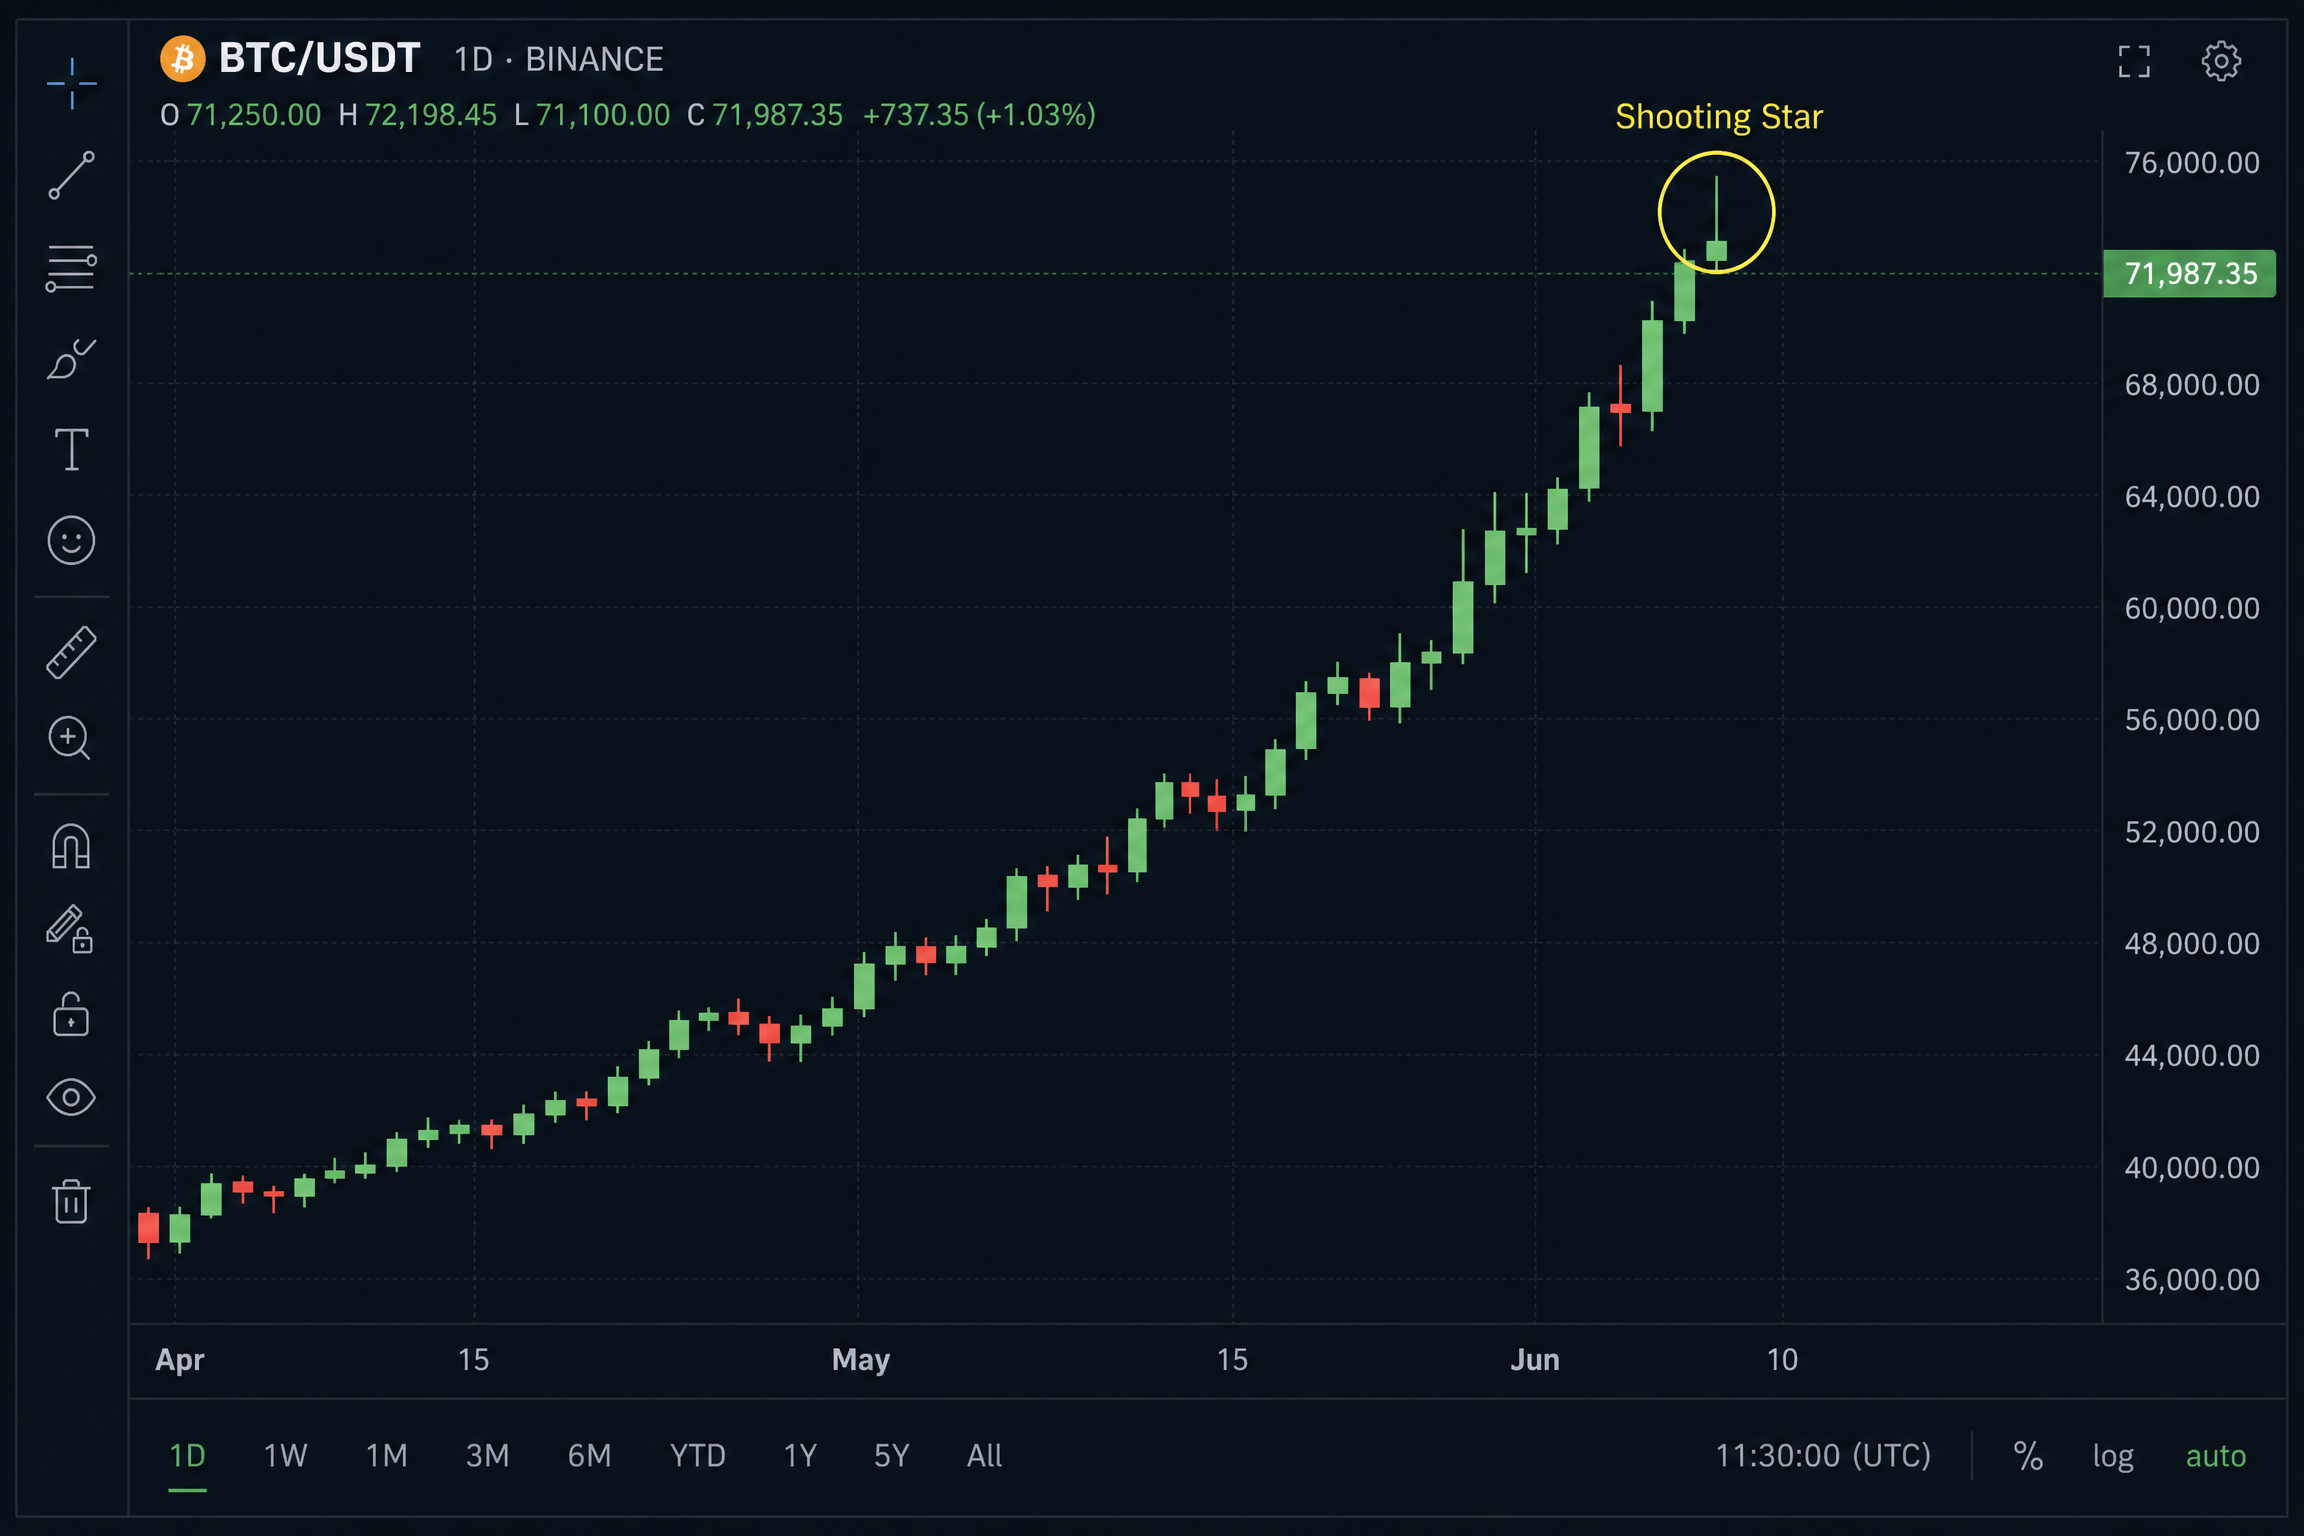
2.Appearance at the Top: It should form at or near the peak of an uptrend, often at a resistance level. This adds to its significance.
3.Confirmation: While the Shooting Star is a strong signal, I always wait for confirmation. This usually means seeing a bearish candle close below the Shooting Star's low, or a significant drop in price on the next candle.
Trading the Shooting Star: My Approach
Okay, so you've spotted one. Now what? Here's how I think about trading this pattern, but remember, this isn't a crystal ball – it's about managing probabilities.
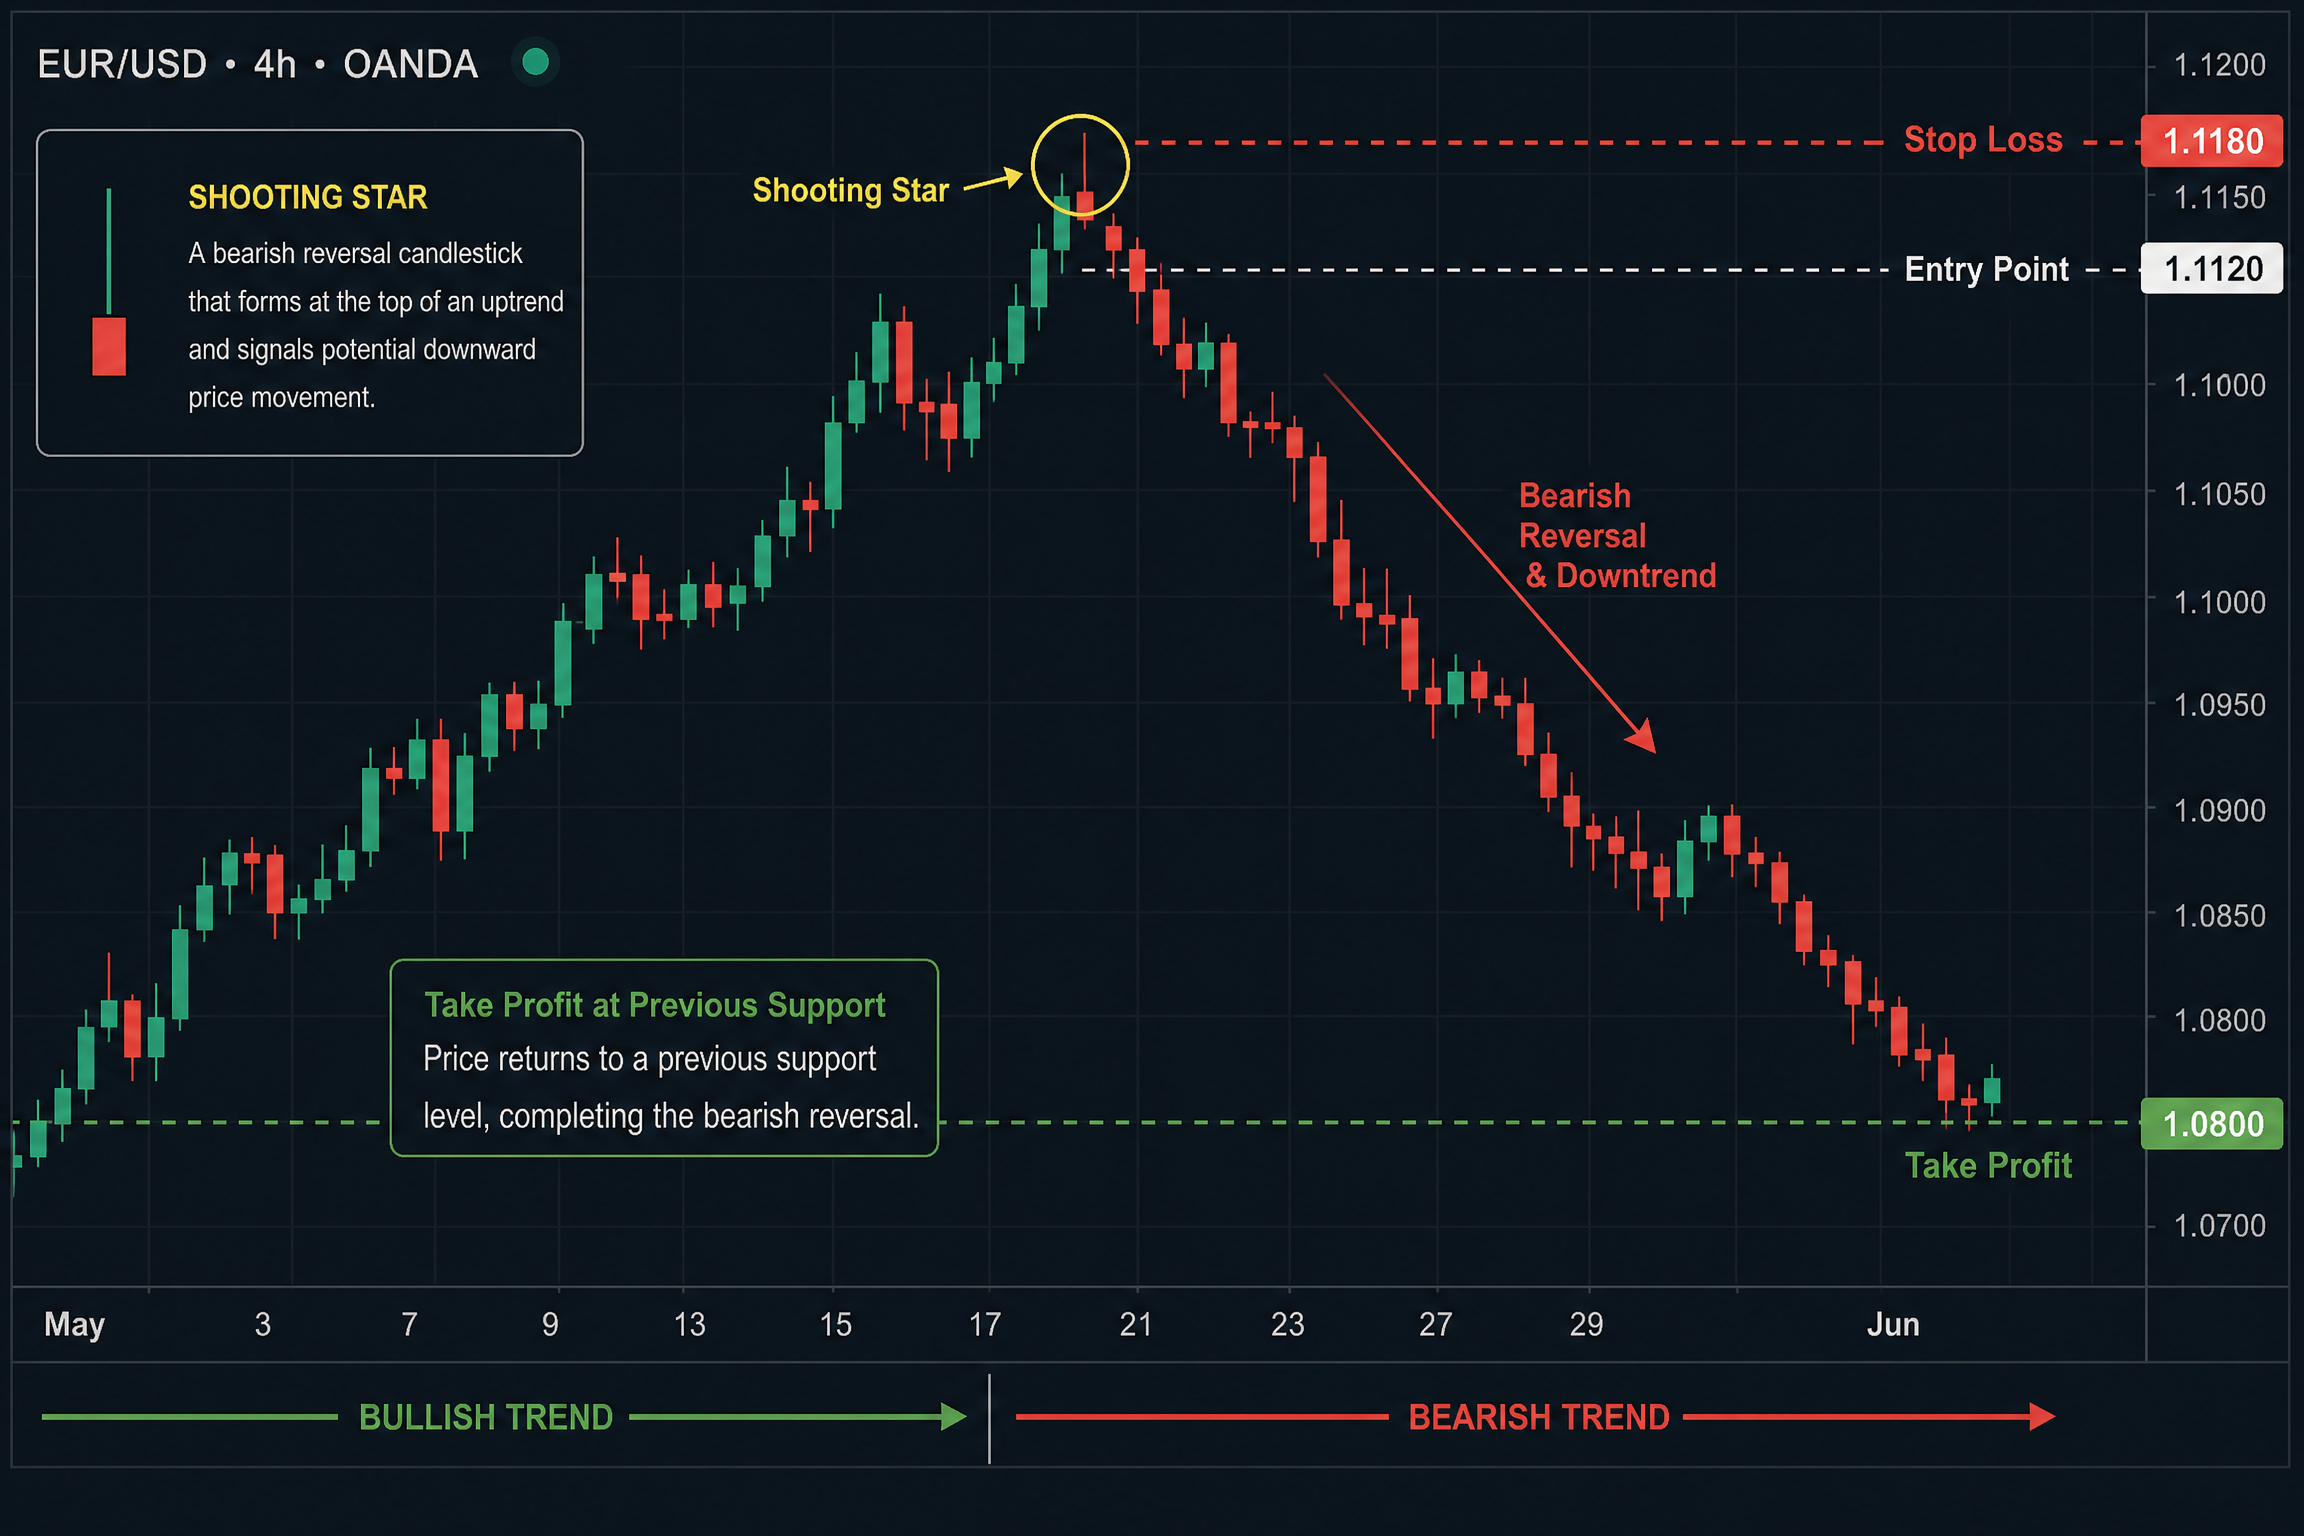
•Entry Point: I typically look to enter a short position (or exit a long one) after the candle following the Shooting Star closes below its real body or low. This confirms the bearish sentiment.
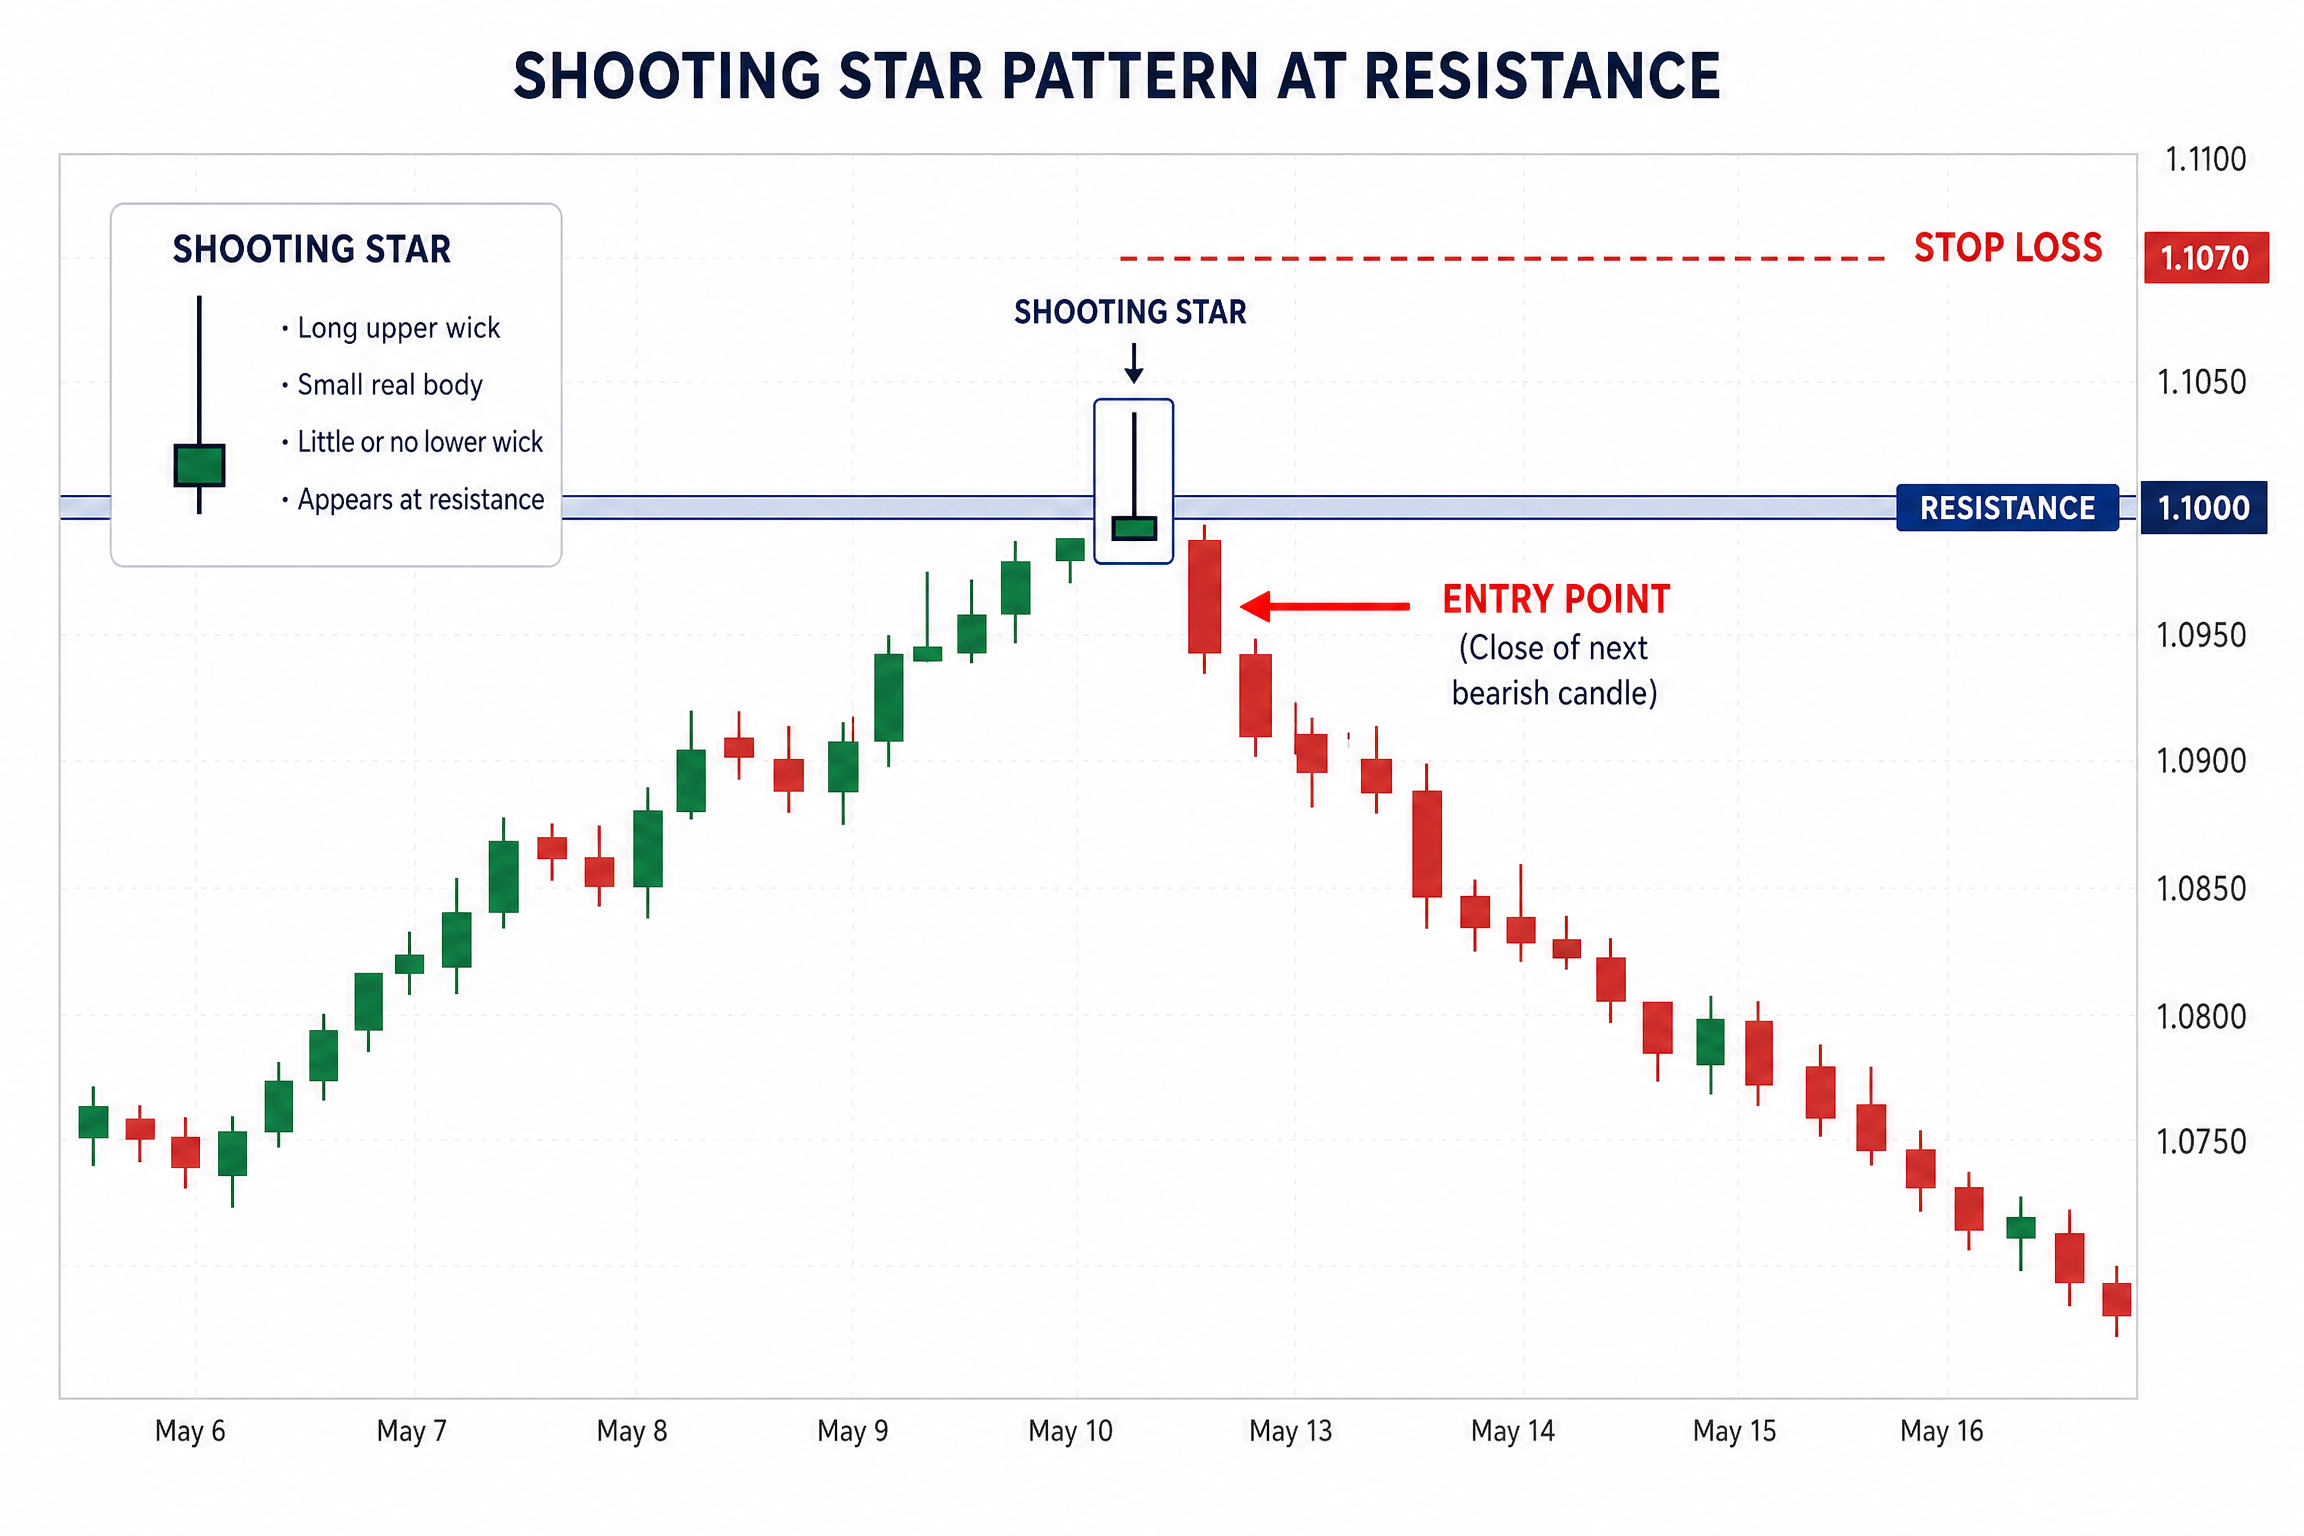
•Stop Loss: Protecting your capital is key. I usually place my stop loss just above the high of the Shooting Star's upper wick. If the price goes above that, my bearish thesis is likely wrong, and it's time to get out.
•Take Profit: For profit targets, I often look for previous support levels. These are areas where the price has bounced before and might find buyers again.
Tips for Confirmation and Avoiding Pitfalls
•Volume Matters: If the Shooting Star forms on high trading volume, it adds more weight to the reversal signal. High volume means more participants were involved in pushing the price down.
•Support & Resistance: Always consider where the Shooting Star appears in relation to key support and resistance levels. A Shooting Star at a strong resistance level is a much more powerful signal.
•Don't Jump the Gun: Patience is a virtue in trading. Don't enter a trade based solely on the Shooting Star. Wait for that confirmation candle. It can save you from false signals.
•Timeframes: The pattern is generally more reliable on longer timeframes (daily, weekly charts) than on shorter ones (hourly, 15-minute charts). On shorter timeframes, there's more noise.
FAQs About the Shooting Star Pattern
Q: Is a Shooting Star always bearish?
A: It's considered a bearish reversal pattern, but it needs to appear in an uptrend and ideally be confirmed by subsequent price action to be a strong signal.
Q: What's the difference between a Shooting Star and an Inverted Hammer?
A: They look identical in shape! The key difference is context. A Shooting Star appears in an uptrend and signals a bearish reversal. An Inverted Hammer appears in a downtrend and signals a bullish reversal.
Q: Can I use the Shooting Star pattern by itself?
A: While it's a powerful pattern, it's best used in conjunction with other technical analysis tools like support/resistance, trend lines, and volume indicators for stronger confirmation.
A Quick Word of Caution
Trading involves risk, and past performance is not indicative of future results. This information is for educational purposes only and should not be considered financial advice. Always do your own research and consult with a financial professional before making any investment decisions.
So, the next time you're scanning those charts, keep an eye out for that little celestial body. The Candlestick Analysis: Shooting Star Pattern could be your early warning system, helping you navigate the market with a bit more confidence.


No comments:
Post a Comment