Ever felt like you're just guessing?
You see a stock dropping like a rock and you think, "This has to be the bottom," right?
Then you buy. And it drops another 20%.
You just caught a falling knife. It hurts. Your bank account hurts.
What if you could actually see the moment the big players—the guys with the real money—decided to stop selling and start buying?
That's what we're talking about today.
What Is This Thing Anyway?
The Hammer Candlestick Pattern is a single bar that tells a story of a failed execution.
Imagine the bears (the sellers) are trying to bury the price. They push it down, down, down.
But then, out of nowhere, the bulls (the buyers) show up. They don't just stop the drop. They push the price all the way back up to where it started.
It looks like a hammer because it's literally hammering out a bottom.
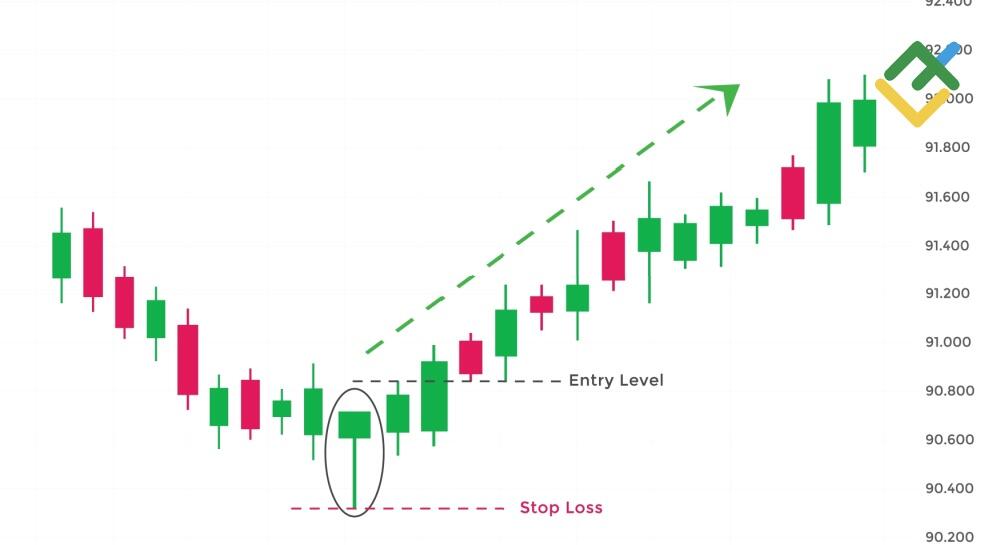
The Anatomy of a Winner
If you want to spot a real hammer, you need to look for three specific things. No exceptions.
•The Body: Small. Tiny. It sits at the very top of the candle.
•The Tail (Wick): Long. I’m talking at least two to three times the size of the body. This is the most important part.
•The Top: Little to no "hair" (upper wick). We want a clean flat top or something very close to it.
You can check more chart patterns in this cheatsheet.
Why the Color Doesn't Matter (Mostly)
I get asked this all the time: "Does it have to be green?"
Short answer: No.
Long answer: A green hammer means the buyers pushed it above the opening price. That’s slightly more "alpha."
A red hammer means they just missed the mark, but the effort was still massive. Both are signals. The shape is the signal, the color is just the seasoning.
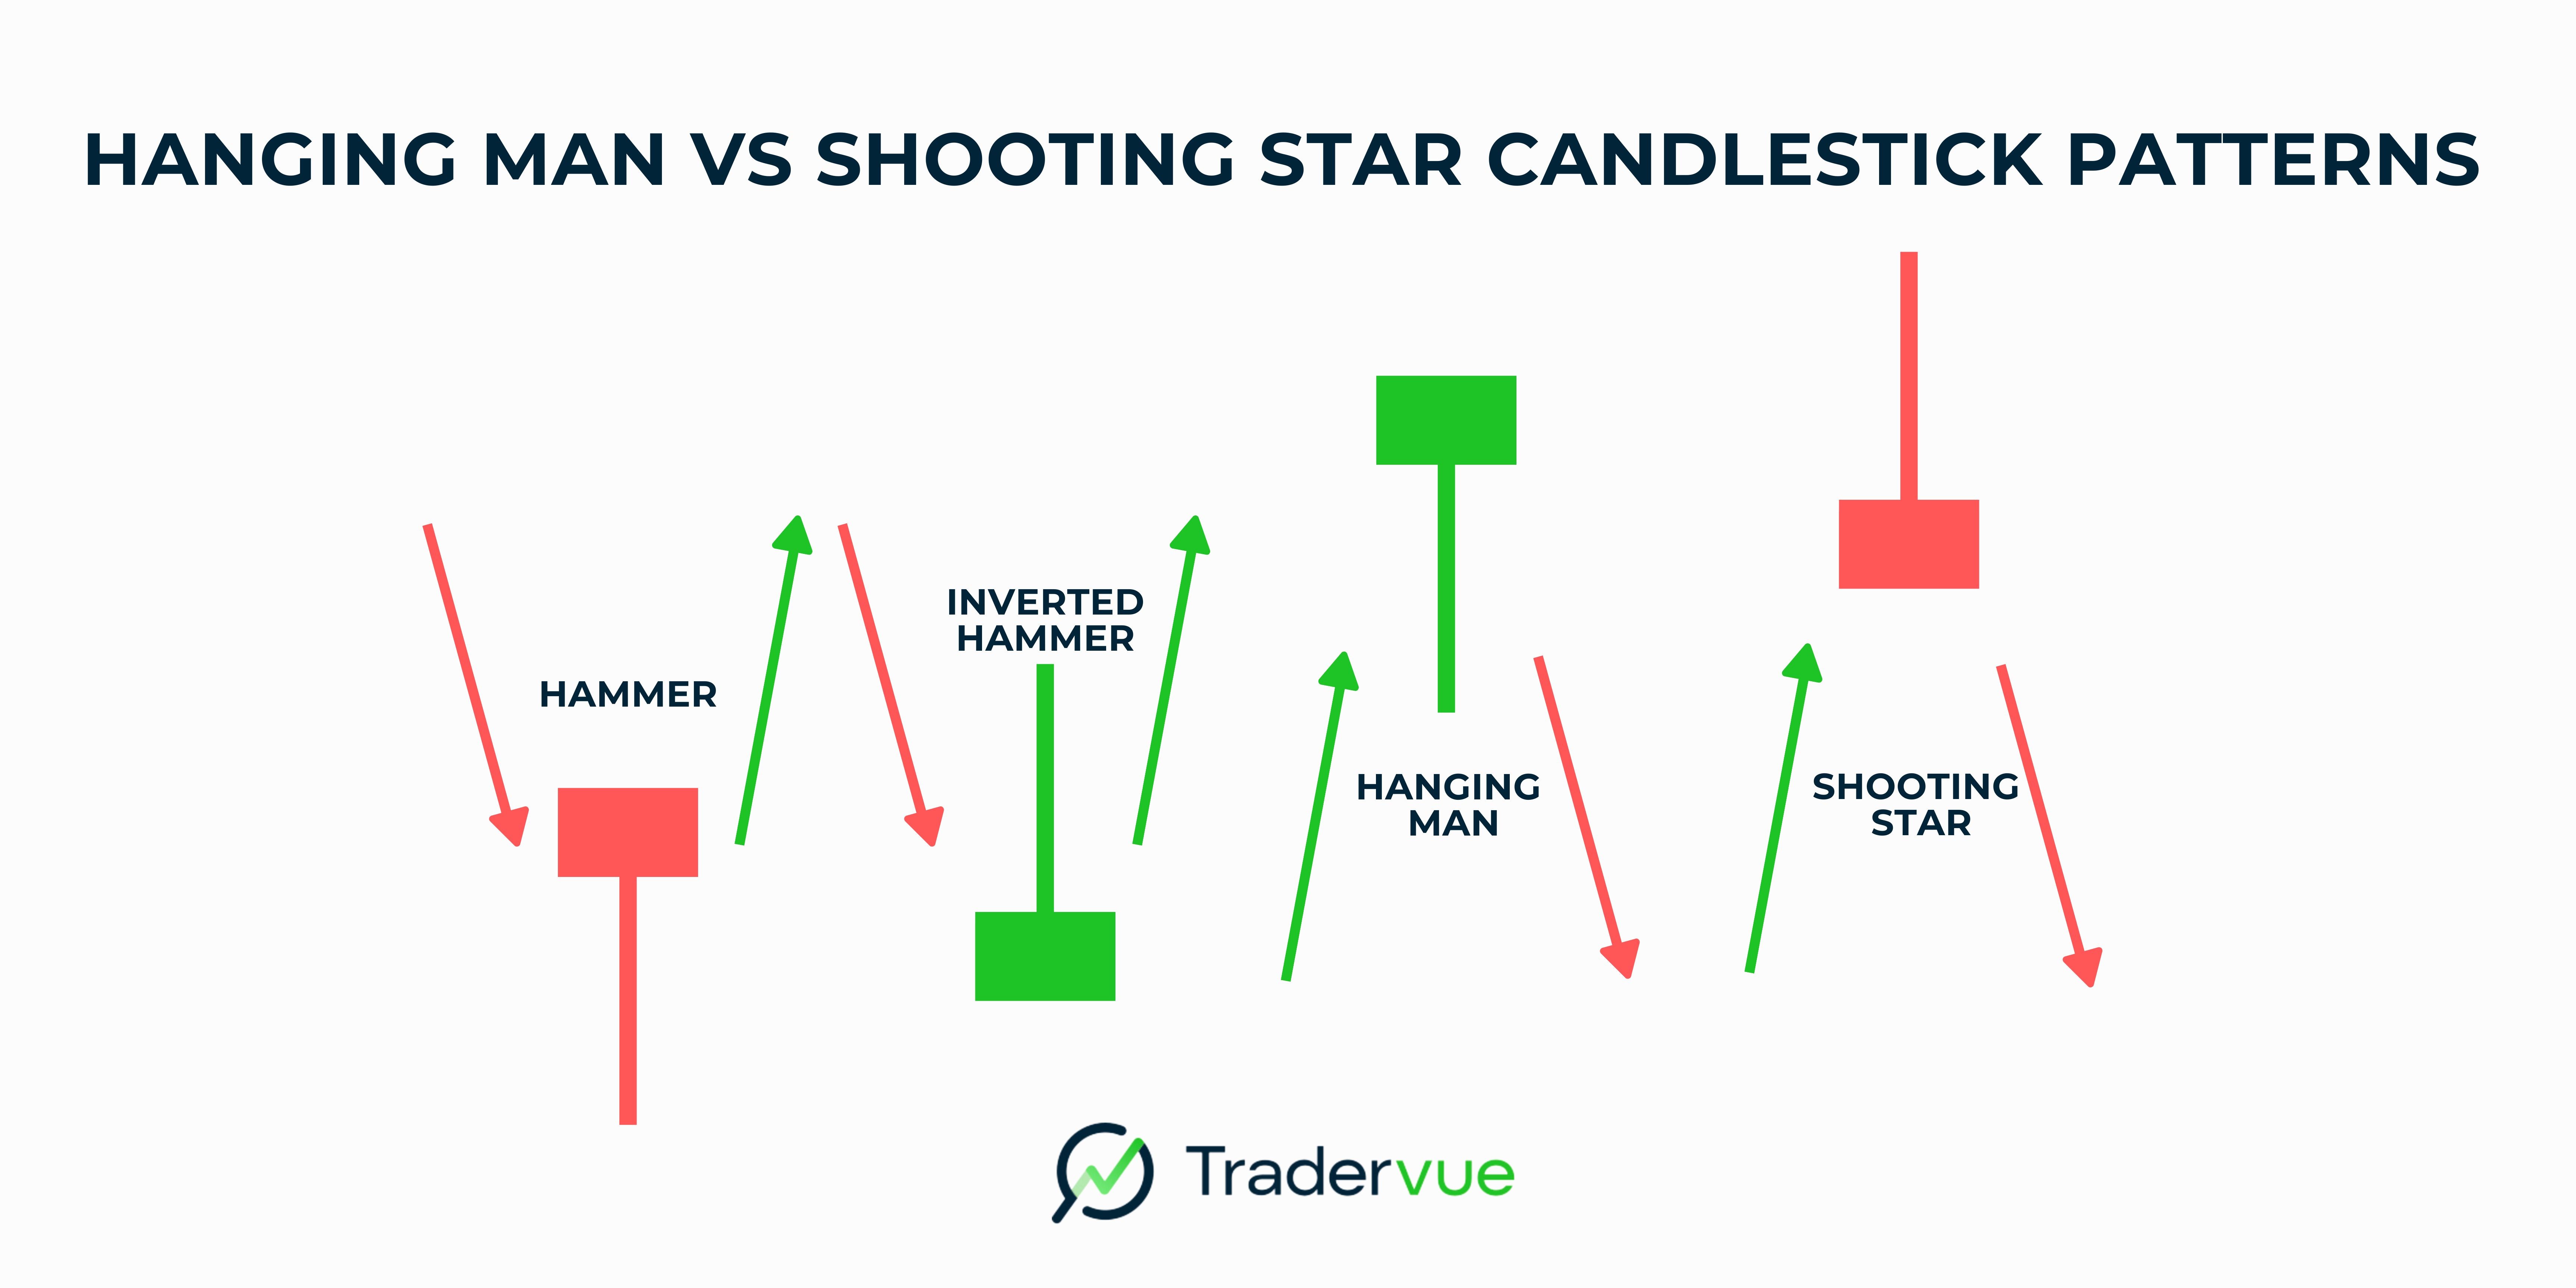
How to Actually Trade This (The No-Fluff Way)
Most people see a hammer and jump in immediately. That’s how you lose money.
You need confirmation.
1.Find a Downtrend: You can't have a reversal if there's nothing to reverse. The price needs to be falling first.
2.Wait for the Hammer: Look for that long tail at a support level.
3.The Next Candle: This is the secret sauce. Wait for the next candle to close higher than the hammer’s body.
4.Set Your Exit: Put your stop-loss right below that long tail. If the price goes there, the story changed. Get out.
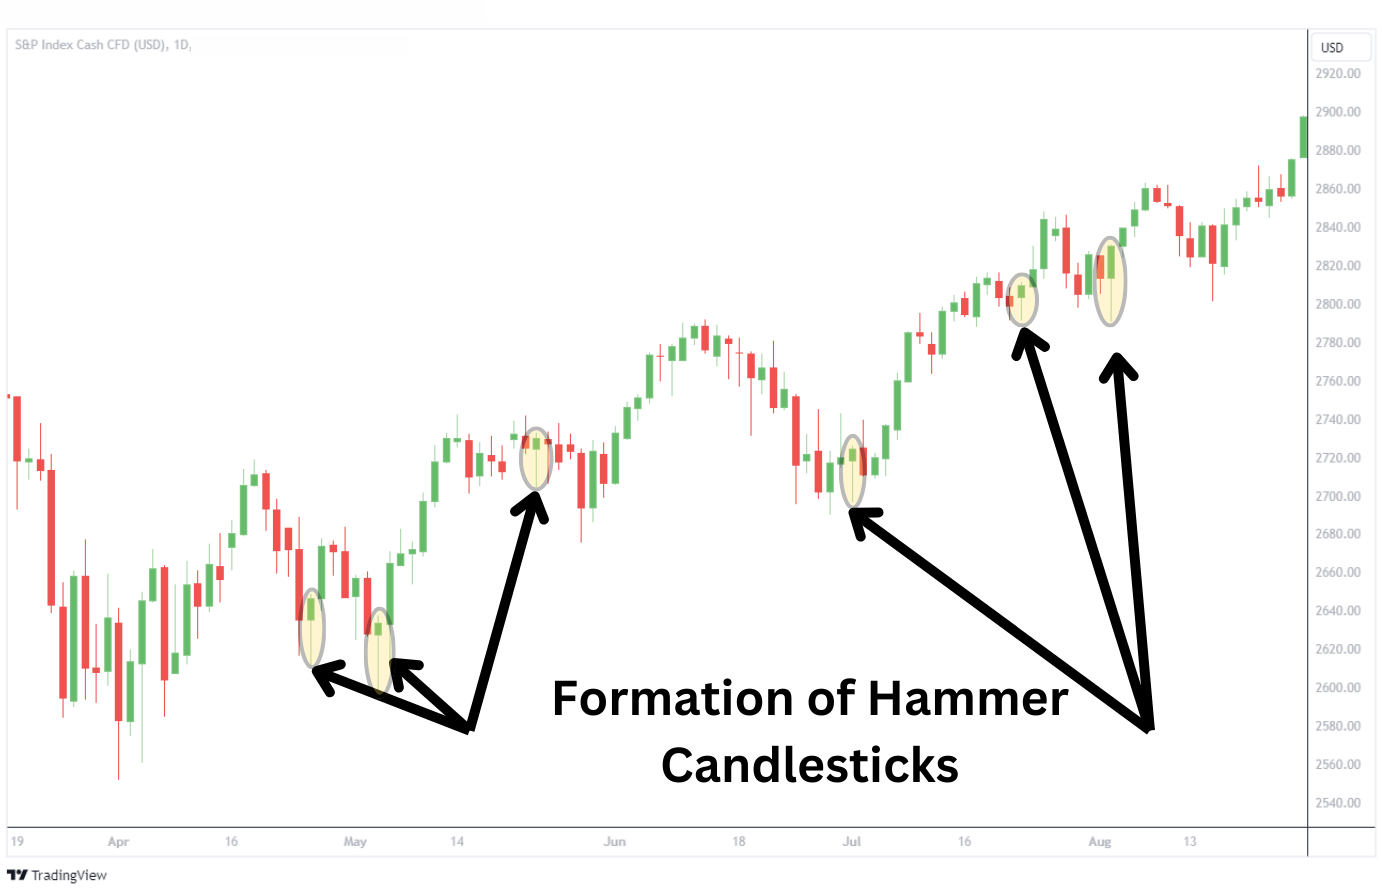
The "Inverted" Cousin
Sometimes the hammer is upside down. We call that the Inverted Hammer.
It shows up at the bottom too. It means buyers tried to break out, got pushed back, but the sellers are exhausted.
It’s still a bullish signal, but it’s like the "beta" version. You need even more confirmation here.
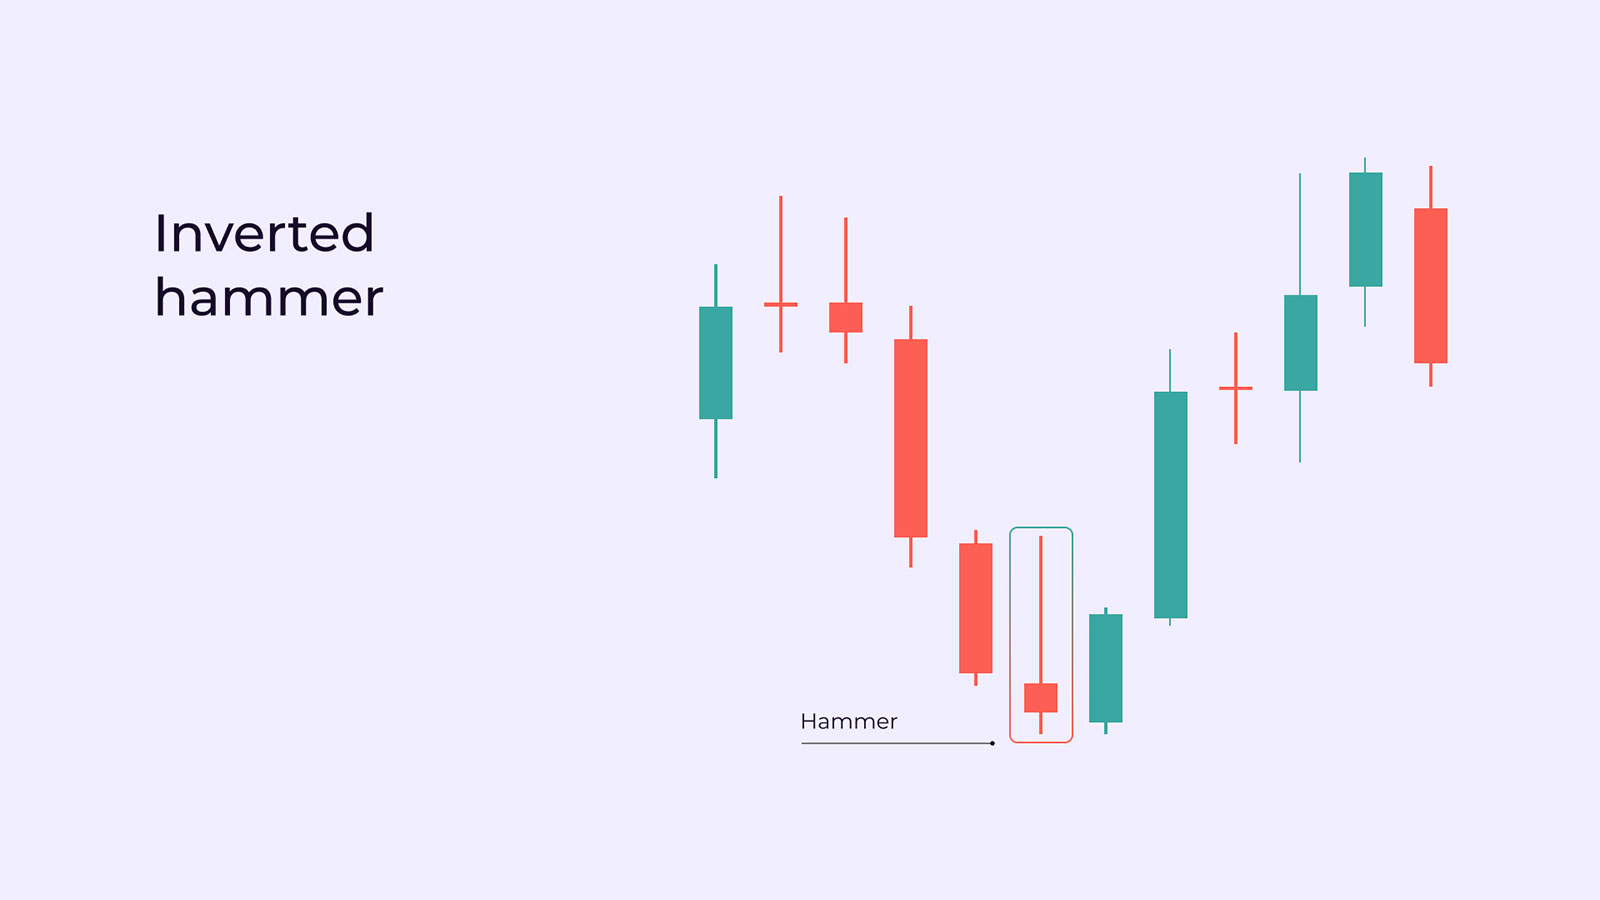
My Insight
I look at charts like I look at business deals.
If a business is losing money every month, I don't buy it just because it's "cheap." I buy it when I see the management change or a new product launch that stops the bleed.
The Hammer is that management change.
It’s the market saying, "Enough is enough."
But remember: One candle isn't a trend. It's an invitation to pay attention.
•Volume is your friend: If the hammer has high volume, it’s a louder shout.
•Location is everything: A hammer in the middle of nowhere is just a candle. A hammer at a major support line is a trade.
-These are the best day trading apps to use-
FAQs: The Stuff You’re Actually Wondering
Question | The Real Answer |
Is it 100% accurate? | Nothing is. It’s a probability tool, not a crystal ball. |
What timeframe is best? | Daily or Weekly. The more time it takes to form, the more "truth" it carries. |
What if the tail is short? | Then it’s not a hammer. It’s just a boring candle. Move on. |
Can I use it for Crypto? | Yes. Humans trade crypto, and humans have the same fear/greed cycles everywhere. |
The Bottom Line
Stop guessing where the bottom is.
Wait for the market to tell you.
Look for the long tails. Wait for the confirmation. Manage your risk.
That’s how you stay in the game long enough to actually win.
Hammer Candlestick Pattern: Reversal Chart Pattern.
Disclaimer: This is for educational purposes only. I am not a financial advisor. Trading involves significant risk. Don't bet the house on a single candle.


No comments:
Post a Comment