Let's talk about the Liquidity Sweep / Stop Hunt Trading Strategy.
Ever felt like the market has a personal vendetta against your stop-loss? You place your trade, set your stop, and boom – price hits your stop, only to reverse and go exactly where you thought it would. Frustrating, right? It's not bad luck. It's often by design.
This isn't financial advice. It's just me sharing what I've learned, so you can think for yourself.
What the Heck is a Liquidity Sweep / Stop Hunt?
Imagine you're at a poker table. You've got a good hand, but the big players are watching everyone's tells. They know where your chips are vulnerable.
In trading, those big players are institutions, and your stop-loss is their target. They need liquidity to fill their massive orders without moving the market against them.
Think of it like this: they need to buy a huge amount of shares, but if they just dump all their money at once, the price will skyrocket before they get all their shares. So, they create a situation where a lot of people are forced to sell, providing them with the liquidity they need to buy at a good price.
Liquidity Sweep vs. Stop Hunt: What's the Difference?
These terms are often used interchangeably, but there's a subtle, yet crucial, distinction. It's like the difference between a quick jab and a strategic knockout punch.
•Stop Hunt: This is a quick, aggressive move designed to trigger a cluster of stop-loss orders, usually from retail traders. It's a short-term trick, often seen on lower timeframes (like 5-minute or 15-minute charts) . Price briefly pushes past an obvious level, triggers stops, and then snaps back. You get stopped out, and the market goes your way. Classic.
•Liquidity Sweep: This is a more strategic, calculated move by institutions to gather significant liquidity before making a larger, sustained move. It's about efficiently filling massive orders with minimal slippage . These are more reliable on higher timeframes (1-hour, 4-hour, daily charts) because they leave a stronger footprint of institutional intent.
Both are about grabbing liquidity, but the intent and scale differ. A stop hunt is a quick grab; a liquidity sweep is a more deliberate collection for a bigger play.
You can trade this strategy with your broker in TradingView
Why Do These "Traps" Even Happen?
It's not personal, it's just business. Institutions aren't sitting there trying to hunt your specific 100-share stop loss. They're looking for pools of liquidity – areas where many stop losses are clustered. These clusters represent a massive amount of buy or sell orders they can use.
Here's the breakdown:
1. Institutional Order Execution
Big banks, hedge funds, and market makers operate with colossal order sizes. They can't just click a button and expect their multi-million dollar orders to fill without moving the market significantly. They need counterparties. They need liquidity.
Your stop losses, and those of thousands of other retail traders, provide that liquidity. When price hits those stop-loss levels, it triggers market orders, creating a surge of buying or selling pressure that institutions can then absorb to fill their own positions at favorable prices.
2. Market Efficiency & Manipulation (The Good Kind, For Them)
By engineering these price movements, institutions ensure the market moves in a more efficient, controlled manner. It's not about being evil; it's about optimizing their own trades. They're not manipulating the market to hurt you, but to benefit themselves. It's a byproduct of their size and need for liquidity.
3. Predictable Retail Trader Behavior
Let's be honest. Most of us place our stop losses in pretty obvious spots:
•Just above a resistance level.
•Just below a support level.
•At round numbers (like $100 or 1.3000 in Forex).
•At previous swing highs or lows.
These become magnets for liquidity. Institutions know this. They use algorithms to detect these clusters and then push price into those areas. It's like shooting fish in a barrel, but with money .
How to Spot a Liquidity Sweep / Stop Hunt (And Not Get Played)
This is where you start thinking like the big dogs. You stop being the prey and start understanding the hunter. It's about reading the signs, not just reacting to price.
1. Look for Key Levels
These are the usual suspects where liquidity tends to gather:
•Swing Highs and Lows: Obvious places where traders protect their positions.
•Support and Resistance Zones: Everyone sees these, so everyone places stops around them.
•Psychological Price Levels: Round numbers are easy to remember, making them popular stop-loss locations.
•Prior Day's/Week's High/Low: These act as significant reference points for many traders .
2. The Tell-Tale Signs on the Chart
When a liquidity grab is happening, the chart often screams it. You just need to know what to listen for:
•Sharp Wick Rejections: Price pushes aggressively past a key level, but then quickly snaps back, leaving a long wick. This is often the footprint of a stop hunt.
•Volume Spikes Without Follow-Through: You see a huge surge in volume as price breaks a level, but then the momentum dies immediately, and price reverses. This indicates that the volume was primarily stop-loss orders being triggered, not genuine buying/selling interest for a sustained move .
•Price Quickly Returns Inside the Prior Range: After breaking out, price doesn't stay outside. It quickly re-enters the range it came from, signaling a false breakout .
Pro Tip: If price sweeps above a resistance level and then closes back inside the range with high volume, that's often a liquidity grab, not a true breakout. Don't chase it.
Trading the Liquidity Sweep / Stop Hunt Strategy: Turn the Tables
Now, how do you use this knowledge to your advantage? You stop being the victim and start aligning with the institutional flow. It's about patience and precision.
1. Wait for Confirmation
This is huge. Don't jump in on the first sign of a breakout. Wait for the market to show its true colors. Let the institutions do their dirty work, then join them.
•Look for price to sweep liquidity, then return inside the prior structure. This is your cue.
•Confirm with rejection wicks, volume shifts, or market structure breaks. These are your green lights .
2. Smart Stop-Loss Placement
Your stop loss is your protection, but if it's too obvious, it's a target. Think differently.
•Place stops wider than obvious liquidity zones. Give your trade room to breathe, away from the immediate hunting grounds.
•Use structure-based stops. Instead of a fixed number of pips, place your stop below a significant swing low (for a long) or above a swing high (for a short) .
3. Enter After the Hunt is Over
Timing is everything. You want to enter when the institutions have finished accumulating their positions and are ready to make their move.
•Look for strong rejection candles or market structure shifts after the liquidity grab. This signals the institutional intent.
•Enter with confluence. Combine this with other tools like order flow or volume profile to increase your conviction .
•Tight risk management is key. Your entry should be after the sweep, not before. This allows for a tighter stop and better risk-reward.
Visualizing the Play
Let's look at some examples to make this concrete.
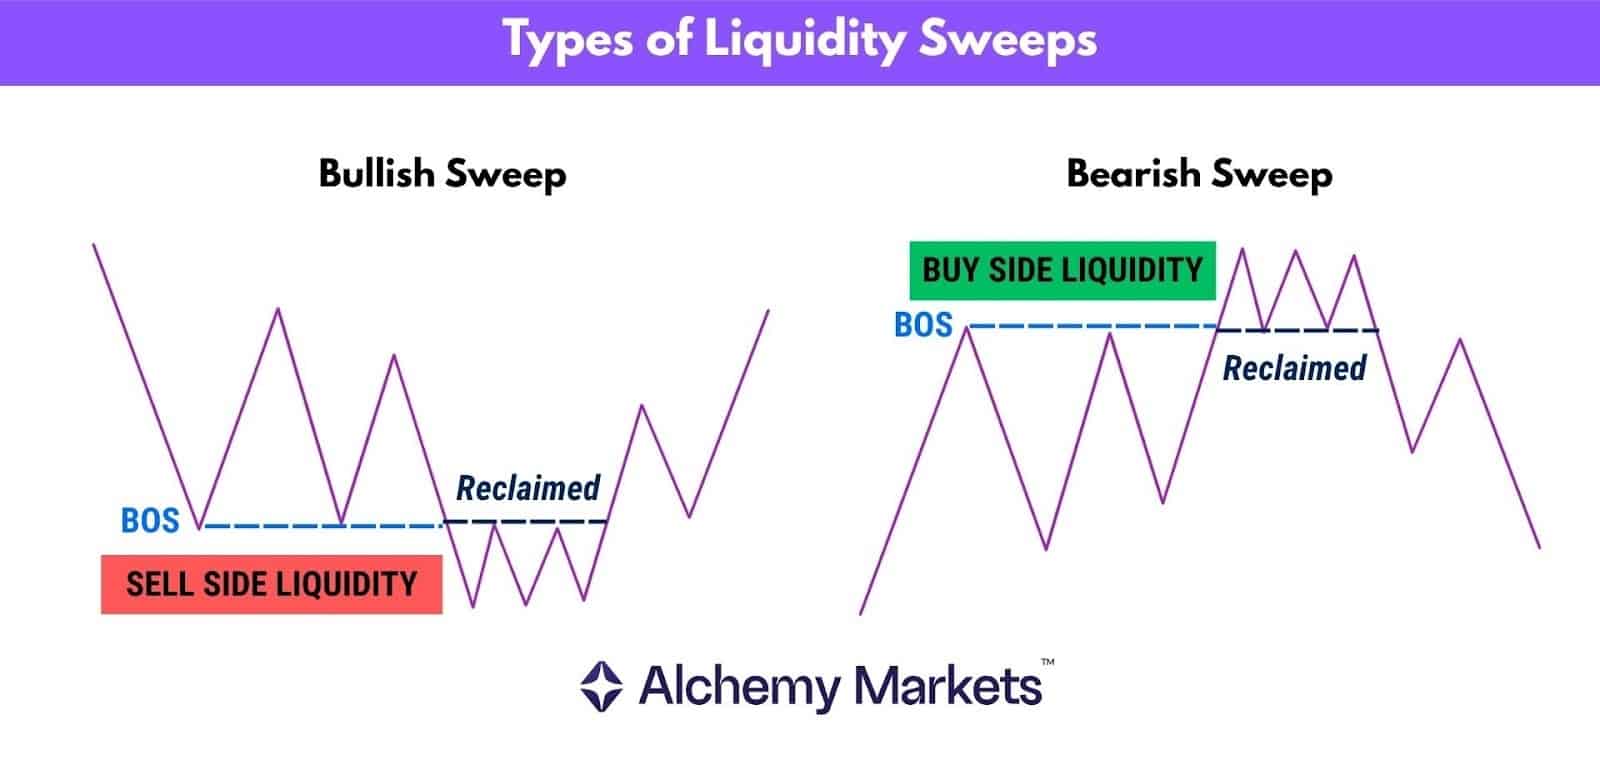
Figure 1: This image illustrates both bullish and bearish liquidity sweeps, showing how price moves to grab liquidity before reversing. Notice how theprice dips below a previous low (sell-side liquidity) or spikes above a previous high (buy-side liquidity) before continuing in the intended direction.
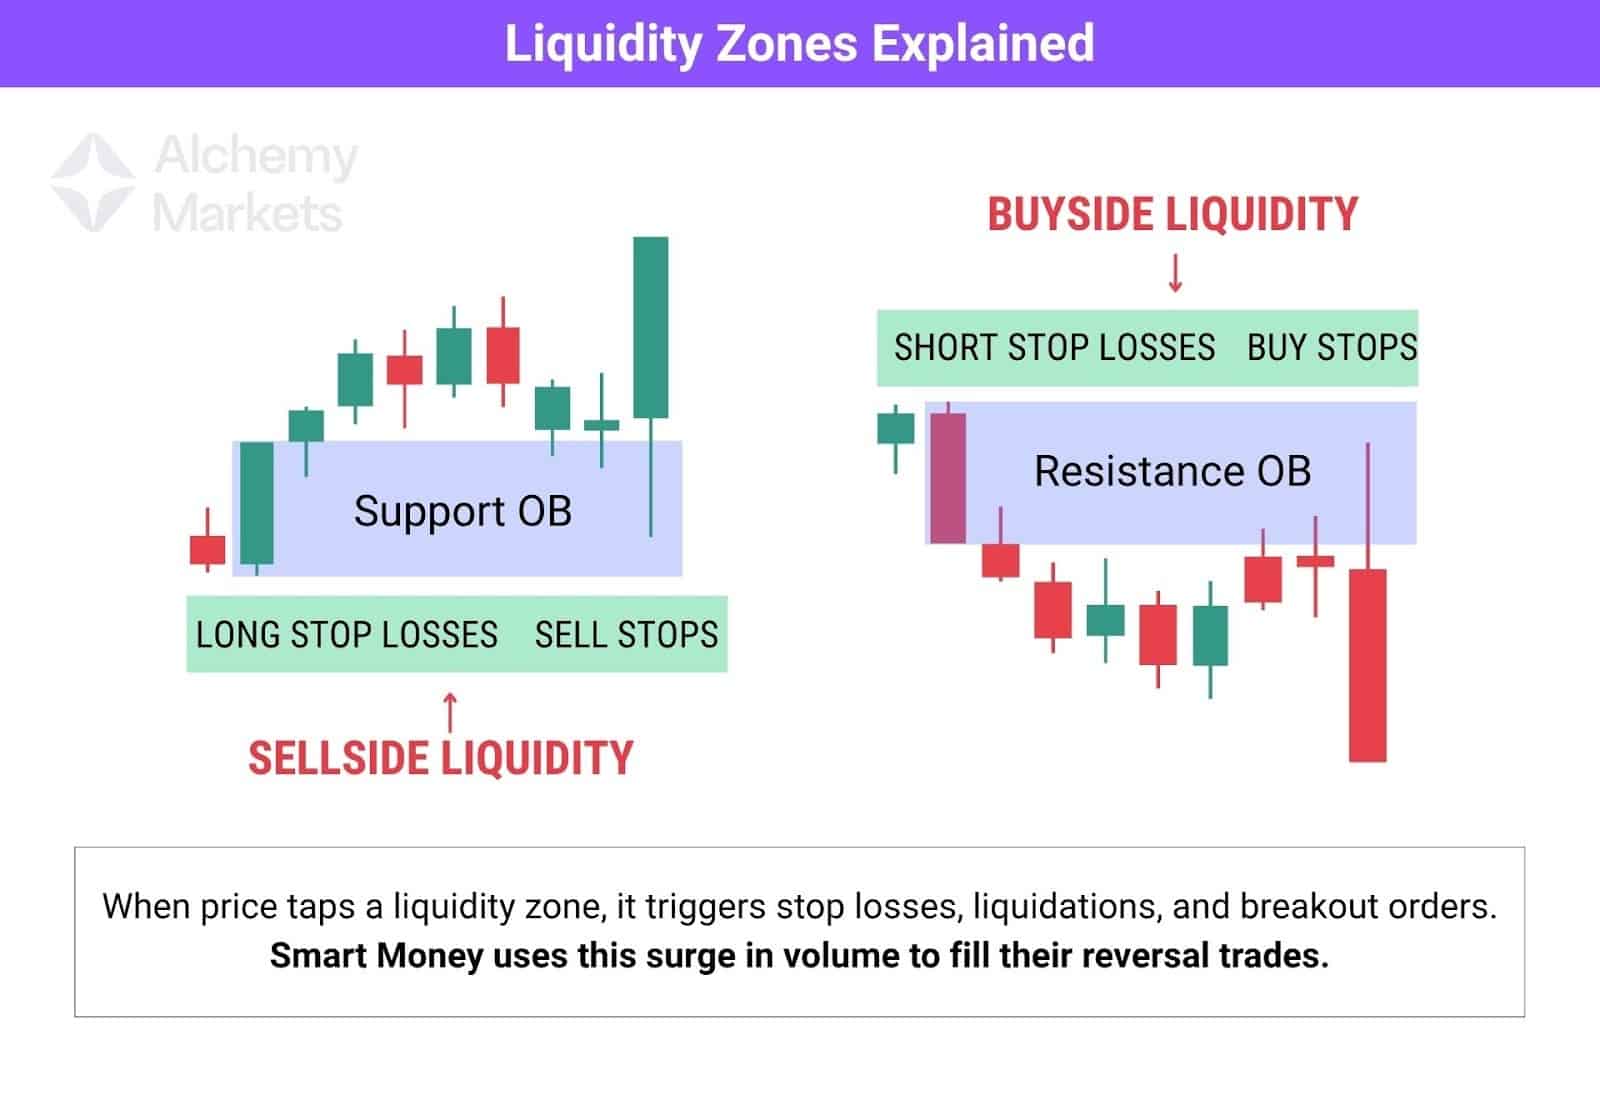
Figure 2: Here we see how liquidity zones are formed around support and resistance blocks. Institutions target these areas because they know retail traders place their stop losses there. When price taps these zones, it triggers those stops, providing the necessary volume for smart money to enter their reversal trades.
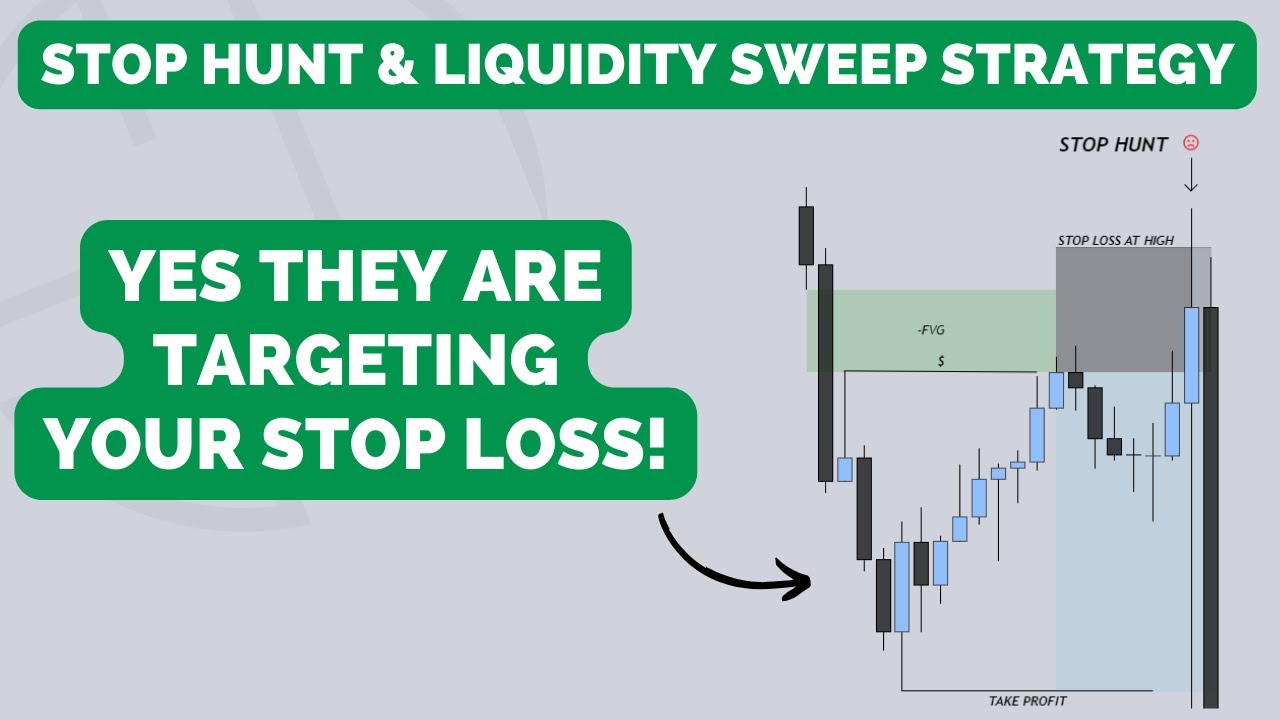
Figure 3: A classic stop hunt scenario. Price pushes up, seemingly breaking out, only to trigger stop losses placed above the previous high. Once the liquidity is grabbed, the price reverses sharply, trapping those who bought the breakout and stopping out those who were short.
Stop Hunts vs. Liquidity Sweeps: A Quick Comparison
To make it crystal clear, here's a breakdown of the key differences:
Feature | Stop Hunt | Liquidity Sweep |
Primary Goal | Trigger crowded retail stops for a quick liquidity tap . | Collect sufficient buy/sell liquidity to fill large institutional orders . |
Signature Price Action | Sharp wick beyond an obvious level, quick snap-back . | Run of buy-side/sell-side liquidity, then displacement away . |
Timeframe Tendency | Most visible on lower timeframes (1–15m), short-lived . | Clearer on higher timeframes (1h/4h/D), leaves structure footprint . |
Likely Outcome | Fast reversal back into prior range . | Follow-through in smart-money direction (continuation or a new trend leg) . |
Volume Character | Spike then fade (exhaustion) . | Sustained/decisive volume during and after the sweep . |
Q: Are brokers actually hunting my stop loss?
A: It's a common myth, but no, your broker isn't likely sitting there targeting your specific 100-share order. It's the larger market participants—institutions, hedge funds, market makers—who are targeting clusters of liquidity where many retail stops are placed. They need that volume to execute their massive trades efficiently.
Q: How can I avoid getting caught in a stop hunt?
A: The best defense is awareness. Avoid placing your stops at the most obvious levels (like exactly at a round number or right on a major support/resistance line). Give your trades a little more breathing room. Also, wait for confirmation before entering a trade, especially around key levels. Don't just jump in on the first sign of a breakout.
Q: Is trading liquidity sweeps a guaranteed strategy?
A: Nothing in trading is guaranteed. While understanding liquidity sweeps gives you a significant edge by aligning you with institutional order flow, it's not a magic bullet. You still need proper risk management, discipline, and a solid understanding of market structure.
Q: What timeframes are best for spotting liquidity sweeps?
A: While stop hunts are often seen on lower timeframes (like the 5-minute or 15-minute charts), true liquidity sweeps are generally more reliable and impactful on higher timeframes, such as the 1-hour, 4-hour, or daily charts. These higher timeframes show the broader institutional intent more clearly .
The Bottom Line
The market isn't out to get you, but it is designed to take money from the uninformed and give it to the informed. Understanding the Liquidity Sweep / Stop Hunt Trading Strategy is about moving from the former group to the latter.
It's about recognizing that those frustrating moments when you get stopped out right before the market goes your way aren't just bad luck—they're engineered moves by institutions seeking liquidity.
By learning to spot these traps, waiting for confirmation, and adjusting your stop-loss placement, you can stop being the liquidity and start trading alongside the smart money. Keep it real, stay disciplined, and always manage your risk.


No comments:
Post a Comment