Ever wonder how some people consistently pick winning stocks while others just… guess?
It’s not magic. It’s not luck. It’s about knowing your numbers. And when it comes to financial ratios for stock picking, these are your secret weapons.
Let’s be real. The stock market can feel like a casino if you don’t know what you’re doing. You hear about P/E ratios, ROE, Debt-to-Equity, and your eyes glaze over. But what if I told you these aren’t just fancy terms? They’re direct insights into a company’s health, its potential, and whether it’s a good bet for your hard-earned cash.
I’ve seen too many people throw money at stocks based on hype or a hot tip from their buddy. That’s a fast track to losing your shirt. My goal here is to give you the no-fluff, straight-talk guide to the financial ratios that actually matter. The ones that can help you identify solid businesses and avoid the duds.
Why Bother with Financial Ratios? Because Hype Doesn't Pay the Bills.
Think about it. When you’re buying a car, you check the mileage, the engine, the service history, right? You don’t just buy it because it looks shiny. Investing in a company is no different. You need to look under the hood.
Financial ratios are your diagnostic tools. They take complex financial statements – the balance sheet, income statement, and cash flow statement – and boil them down into digestible metrics. These metrics allow you to:
•Compare Apples to Apples: See how one company stacks up against its competitors.
•Spot Trends: Understand if a company is getting stronger or weaker over time.
•Uncover Hidden Gems: Find undervalued companies with strong fundamentals.
•Avoid Landmines: Steer clear of businesses teetering on the edge of financial disaster.
Without these ratios, you’re flying blind. And in the market, flying blind usually ends with a crash. So, let’s get into the ratios that will make you a smarter investor.
The Big Players: Ratios You Can't Ignore
We’re not going to drown you in a hundred different ratios. We’re focusing on the heavy hitters. The ones that give you the most bang for your buck in terms of insight. These are the ratios I personally look at, and the ones that have stood the test of time.
To start investing, discover the Best Stock Trading Apps
1. Price-to-Earnings (P/E) Ratio: The Valuation King
This is probably the most famous ratio out there. Everyone talks about it. But do they really understand it?
The P/E ratio tells you how much investors are willing to pay for each dollar of a company’s earnings. It’s a snapshot of market sentiment and expectations.
Formula:
P/E Ratio = Share Price / Earnings Per Share (EPS)
Why it matters:
•Valuation: Is the stock cheap or expensive relative to its earnings? A high P/E might mean investors expect high future growth, or it could mean the stock is overvalued. A low P/E could signal an undervalued stock, or a company with poor growth prospects.
•Industry Comparison: You can’t compare a tech company’s P/E to a utility company’s P/E. They operate in different worlds. Always compare P/E ratios within the same industry.
My Take: Don’t just look at the number. Look at the context. What’s the industry average? What’s the company’s historical P/E? A high P/E isn’t always bad if the growth justifies it. A low P/E isn’t always good if the company is a dying business.
2. Debt-to-Equity (D/E) Ratio: The Risk Barometer
How much debt is a company taking on to finance its operations? This ratio gives you the answer. It’s a critical indicator of financial risk.
Formula:
Debt-to-Equity Ratio = Total Liabilities / Shareholder Equity
Why it matters:
•Financial Leverage: A high D/E ratio means the company is relying heavily on debt. This can amplify returns in good times but can be a huge burden in bad times.
•Solvency: Can the company pay its long-term debts? Too much debt can lead to bankruptcy, especially if interest rates rise or cash flow dries up.
My Take: I like companies with manageable debt. Some industries, like utilities or real estate, naturally have higher debt levels. That’s fine. But if a tech company has a D/E ratio through the roof, I’m out. It’s a red flag. You want stability, not a house of cards.
3. Return on Equity (ROE): The Profitability Powerhouse
This ratio tells you how efficiently a company is using shareholders’ money to generate profits. It’s a direct measure of management effectiveness.
Formula:
Return on Equity (ROE) = Net Income / Shareholder Equity
Why it matters:
•Efficiency: A high ROE means the company is generating a lot of profit from the money invested by its shareholders. This is a sign of a well-run business.
•Growth: Companies with consistently high ROE often have a competitive advantage and can reinvest profits to fuel further growth.
My Take: I look for consistent, high ROE. But be careful. Sometimes ROE can be artificially inflated by high debt. That’s why you need to look at it in conjunction with the D/E ratio. A high ROE with low debt? That’s a winner.
Buying Stocks? Use Our Dividends Income Calculator
4. Current Ratio: The Short-Term Health Check
This ratio assesses a company’s ability to meet its short-term obligations (due within one year) with its short-term assets. It’s a quick look at liquidity.
Formula:
Current Ratio = Current Assets / Current Liabilities
Why it matters:
•Liquidity: A ratio above 1.0 is generally considered healthy, meaning the company has more current assets than current liabilities. A ratio below 1.0 can signal potential liquidity problems.
•Operational Efficiency: It shows how well a company manages its working capital. Too high, and assets might be sitting idle. Too low, and they might struggle to pay bills.
My Take: I prefer a current ratio between 1.5 and 2.0. It shows the company has enough cushion without being inefficient. Anything too low, and I start asking questions. Can they pay their bills? Or are they about to hit a wall?
5. Gross Profit Margin: The Core Business Strength
This ratio tells you how much profit a company makes from its sales after accounting for the direct costs of producing its goods or services. It’s a pure measure of the company’s core business profitability.
Formula:
Gross Profit Margin = (Revenue - Cost of Goods Sold) / Revenue
Why it matters:
•Pricing Power: A high gross profit margin often indicates a company has strong pricing power or efficient production processes.
•Competitive Advantage: Companies with sustainable high margins usually have a strong competitive moat, making it harder for rivals to undercut them.
My Take: I love high gross profit margins. It means the company has a strong product or service that people are willing to pay for, and they’re good at managing their production costs. It’s a sign of a healthy, robust business model.
Beyond the Basics: Advanced Ratios for the Serious Investor
Once you’ve mastered the core ratios, you can start digging deeper. These next few ratios provide even more nuanced insights, helping you refine your stock picking strategy.
6. PEG Ratio: P/E with a Growth Twist
The P/E ratio is great, but it doesn’t account for growth. That’s where the PEG ratio comes in. It compares the P/E ratio to the company’s earnings growth rate.
Formula:
PEG Ratio = P/E Ratio / Earnings Growth Rate (as a whole number)
Why it matters:
•Growth-Adjusted Valuation: A PEG ratio of 1.0 is often considered fair value, meaning the P/E ratio is in line with the growth rate. A PEG below 1.0 might suggest an undervalued growth stock, while a PEG above 1.0 could mean it’s overvalued relative to its growth.
My Take: This is a powerful ratio for growth investors. It helps you avoid paying too much for growth that isn’t there. But remember, predicting future growth is tough. Use analyst estimates with a grain of salt.
7. Enterprise Value to EBIT (EV/EBIT): The Acquisition Lens
This is a more comprehensive valuation metric than P/E, especially useful when comparing companies with different capital structures. It considers both equity and debt, and uses earnings before interest and taxes (EBIT).
Formula:
EV/EBIT = (Market Capitalization + Total Debt - Cash & Equivalents) / Earnings Before Interest & Taxes
Why it matters:
•Holistic Valuation: EV/EBIT gives you a better picture of a company’s total value, as if you were buying the entire business, including its debt and cash.
•Cross-Industry Comparison: It’s better for comparing companies across different industries or with varying levels of debt, as it neutralizes the impact of financing decisions and tax rates.
My Take: When I’m looking at potential acquisition targets, or just trying to get a deeper understanding of a company’s true value, EV/EBIT is my go-to. It cuts through the noise of how a company is financed and gets to the core operating profitability.
8. Return on Invested Capital (ROIC): The Capital Efficiency Champion
While ROE focuses on shareholder equity, ROIC takes it a step further. It measures how well a company generates profits from all the capital it has invested, both debt and equity.
Formula:
ROIC = Net Operating Profit After Tax (NOPAT) / Invested Capital
Why it matters:
•True Profitability: ROIC is arguably the best measure of a company’s ability to allocate capital effectively and generate returns. It shows how much profit the company makes for every dollar of capital it employs.
•Sustainable Advantage: Companies with consistently high ROIC often possess strong competitive advantages, allowing them to earn returns above their cost of capital.
My Take: This is a serious ratio for serious investors. If a company can consistently generate high ROIC, it means they have a fantastic business model and excellent management. These are the companies that compound wealth over the long term.
Putting It All Together: Your Stock Picking Checklist
Look, no single ratio tells the whole story. You need to use them together, like pieces of a puzzle. Here’s a quick checklist of how I approach it:
1.Start with the Big Picture: Look at the P/E ratio. Is it reasonable for the industry? Is it historically in line?
2.Check the Risk: Dive into the Debt-to-Equity ratio. Is the company overleveraged? Can it handle its debt?
3.Assess Profitability: Examine ROE, Gross Profit Margin, and ROIC. Is the company making good money from its operations and capital?
4.Ensure Liquidity: Glance at the Current Ratio. Can they pay their short-term bills?
5.Consider Growth (if applicable): If it’s a growth stock, check the PEG ratio. Are you paying a fair price for that growth?
This isn’t about finding a perfect company. Those don’t exist. It’s about finding good companies at reasonable prices. It’s about understanding the trade-offs and making informed decisions.
Visualizing the Numbers: Because a Picture is Worth a Thousand Ratios
Sometimes, seeing the data helps it click. Here are some visuals to help you grasp these concepts better.
First, a cheat sheet to keep these formulas handy. No need to memorize them all, just know where to find them.
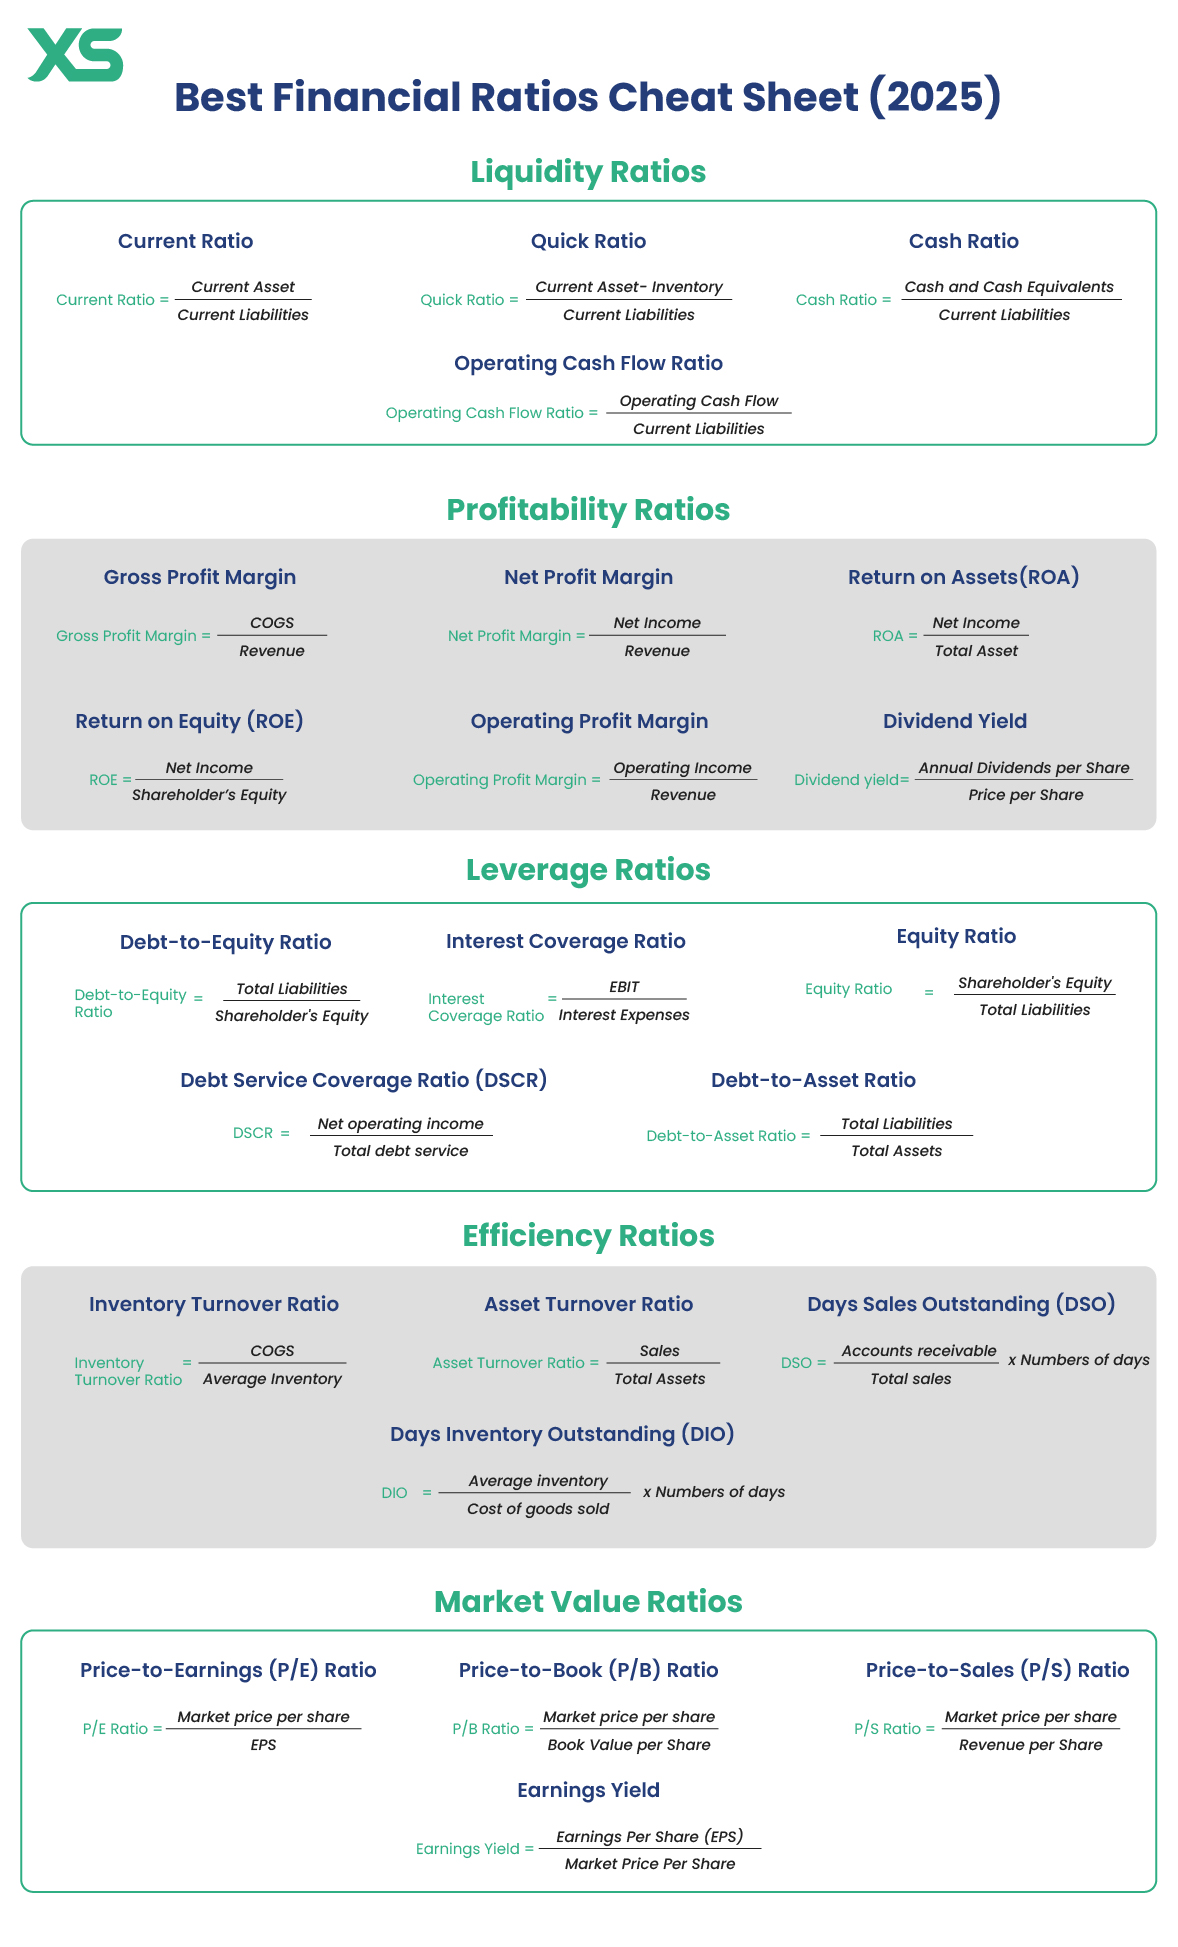
Image Source: EasyVC
And another one, breaking down the top ratios by category. This helps you understand the different aspects of a company’s financial health.
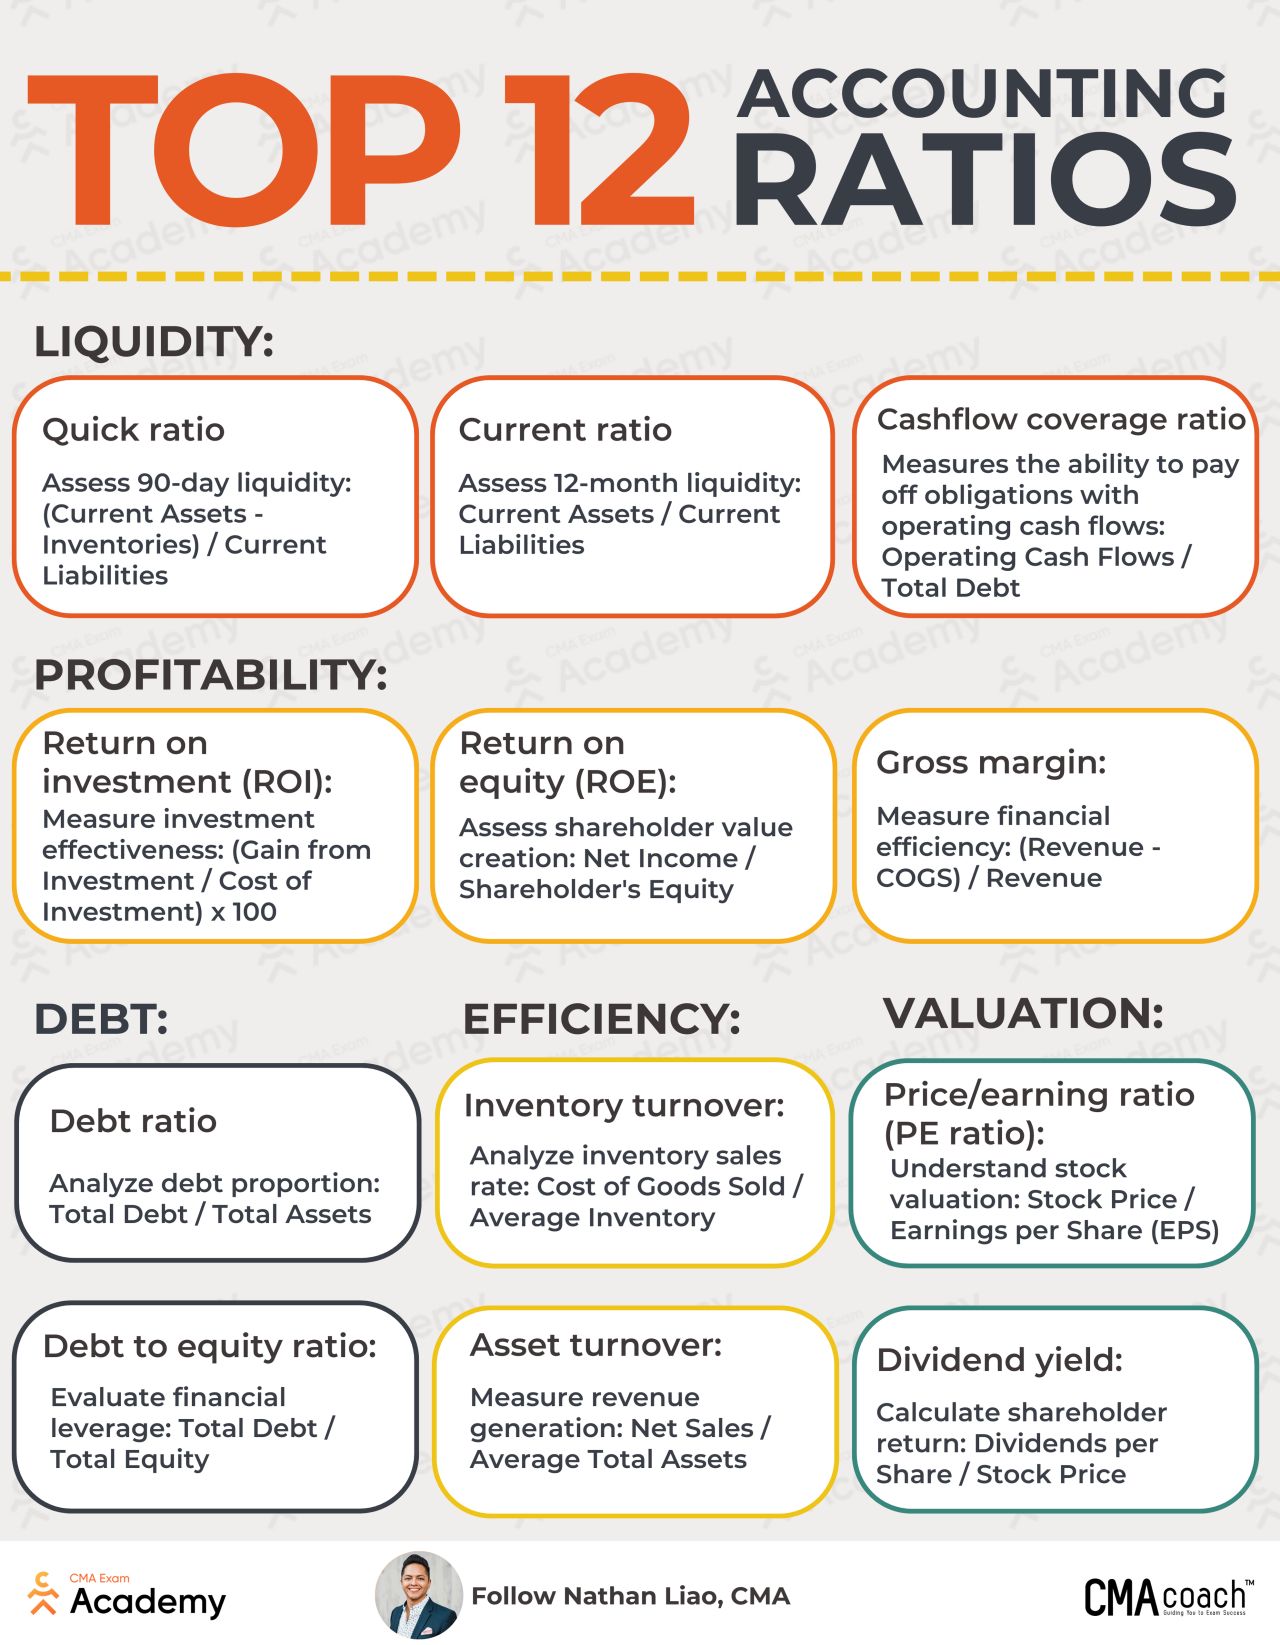
Image Source: CMA Exam Academy
Remember how I talked about the PEG ratio? It’s a powerful tool, but it can be a dubious indicator if not interpreted correctly.
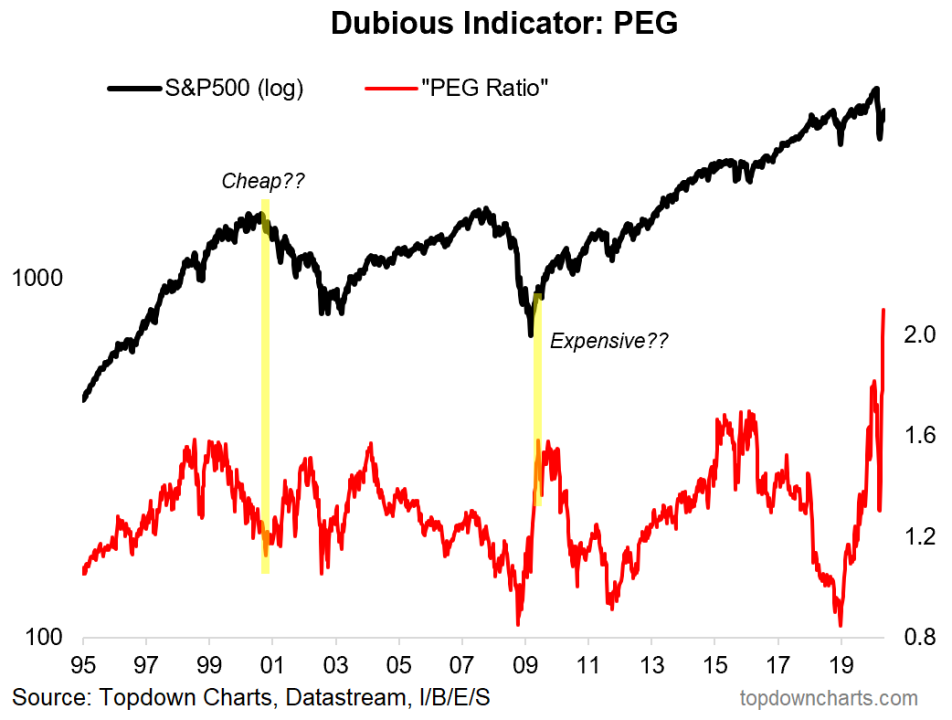
Image Source: Topdown Charts, Datastream, I/B/E/S
And finally, a historical perspective on valuation, showing how certain sectors can become extremely elevated, like the tech sector during the dot-com bubble. This is why context and historical averages are so important.
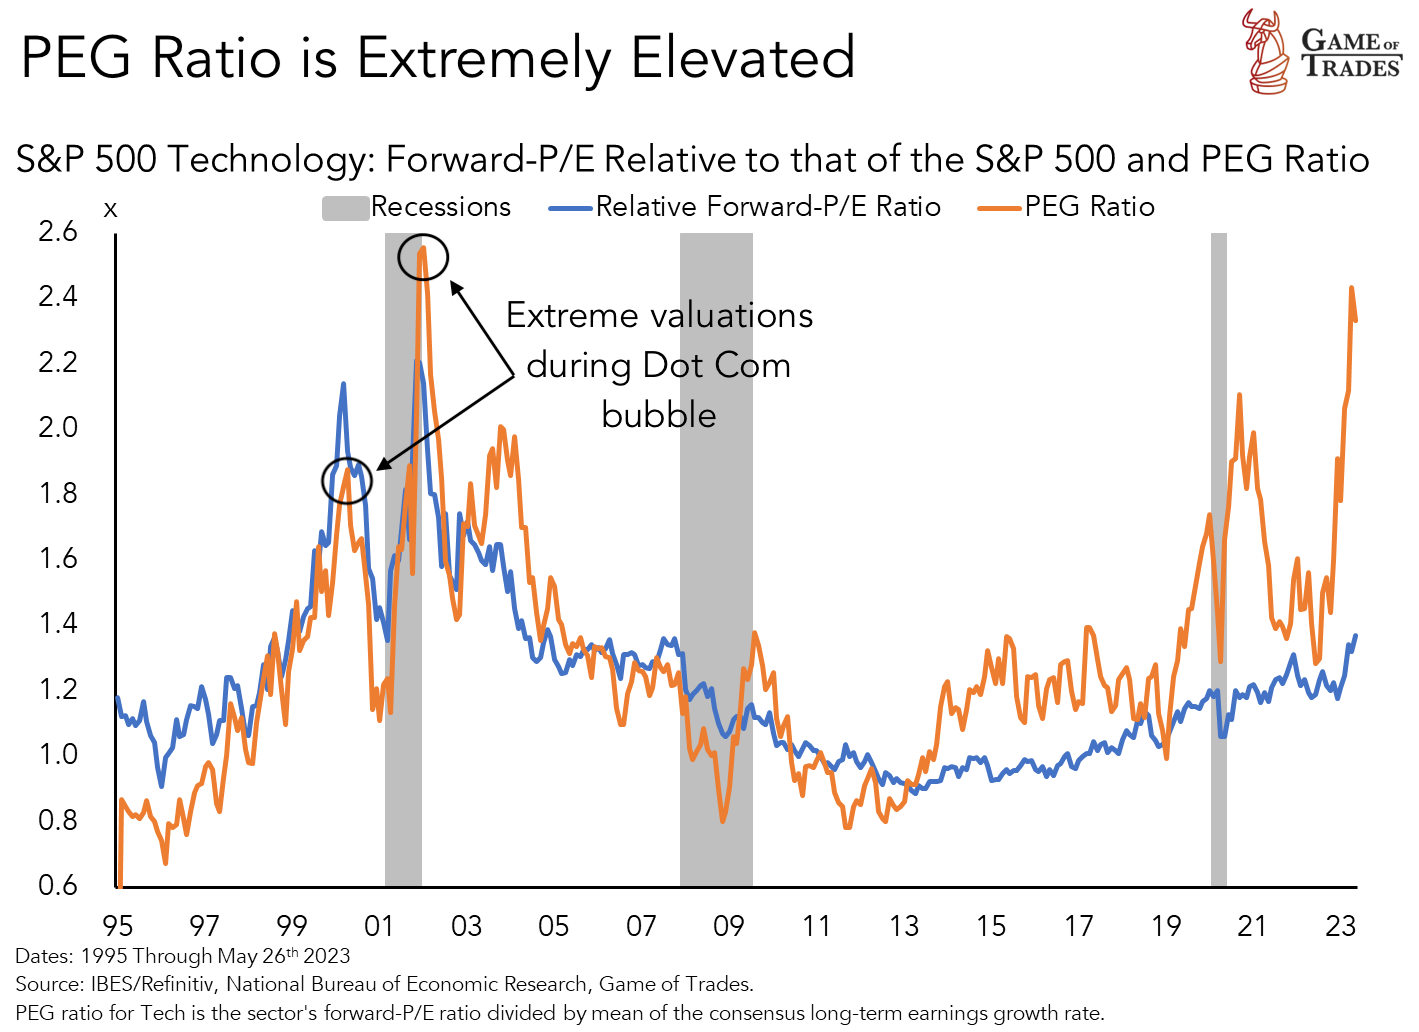
Image Source: Game of Trades
Final Thoughts: Your Journey to Smarter Stock Picking
Look, investing isn’t about being the smartest person in the room. It’s about being disciplined, doing your homework, and making rational decisions.
These financial ratios for stock picking are your tools. They help you cut through the noise, avoid the traps, and identify quality businesses.
Start small, learn consistently, and don’t be afraid to ask questions. The market rewards those who put in the work. Now go out there and make some smart moves. Your future self will thank you.


No comments:
Post a Comment