The Bearish Engulfing Candlestick Pattern is one of the most reliable signals you can find on a price chart when you're looking for a market reversal.
Ever felt like you're always the last one to know when a stock or crypto is about to tank?
You see a green candle, you buy in, and suddenly everything turns red.
It’s a common worry for many traders, but what if I told you the market actually gives you a clear "heads up" before it flips?
That’s exactly what we’re chatting about today over this virtual coffee.
What Exactly Is a Bearish Engulfing Candlestick Pattern?
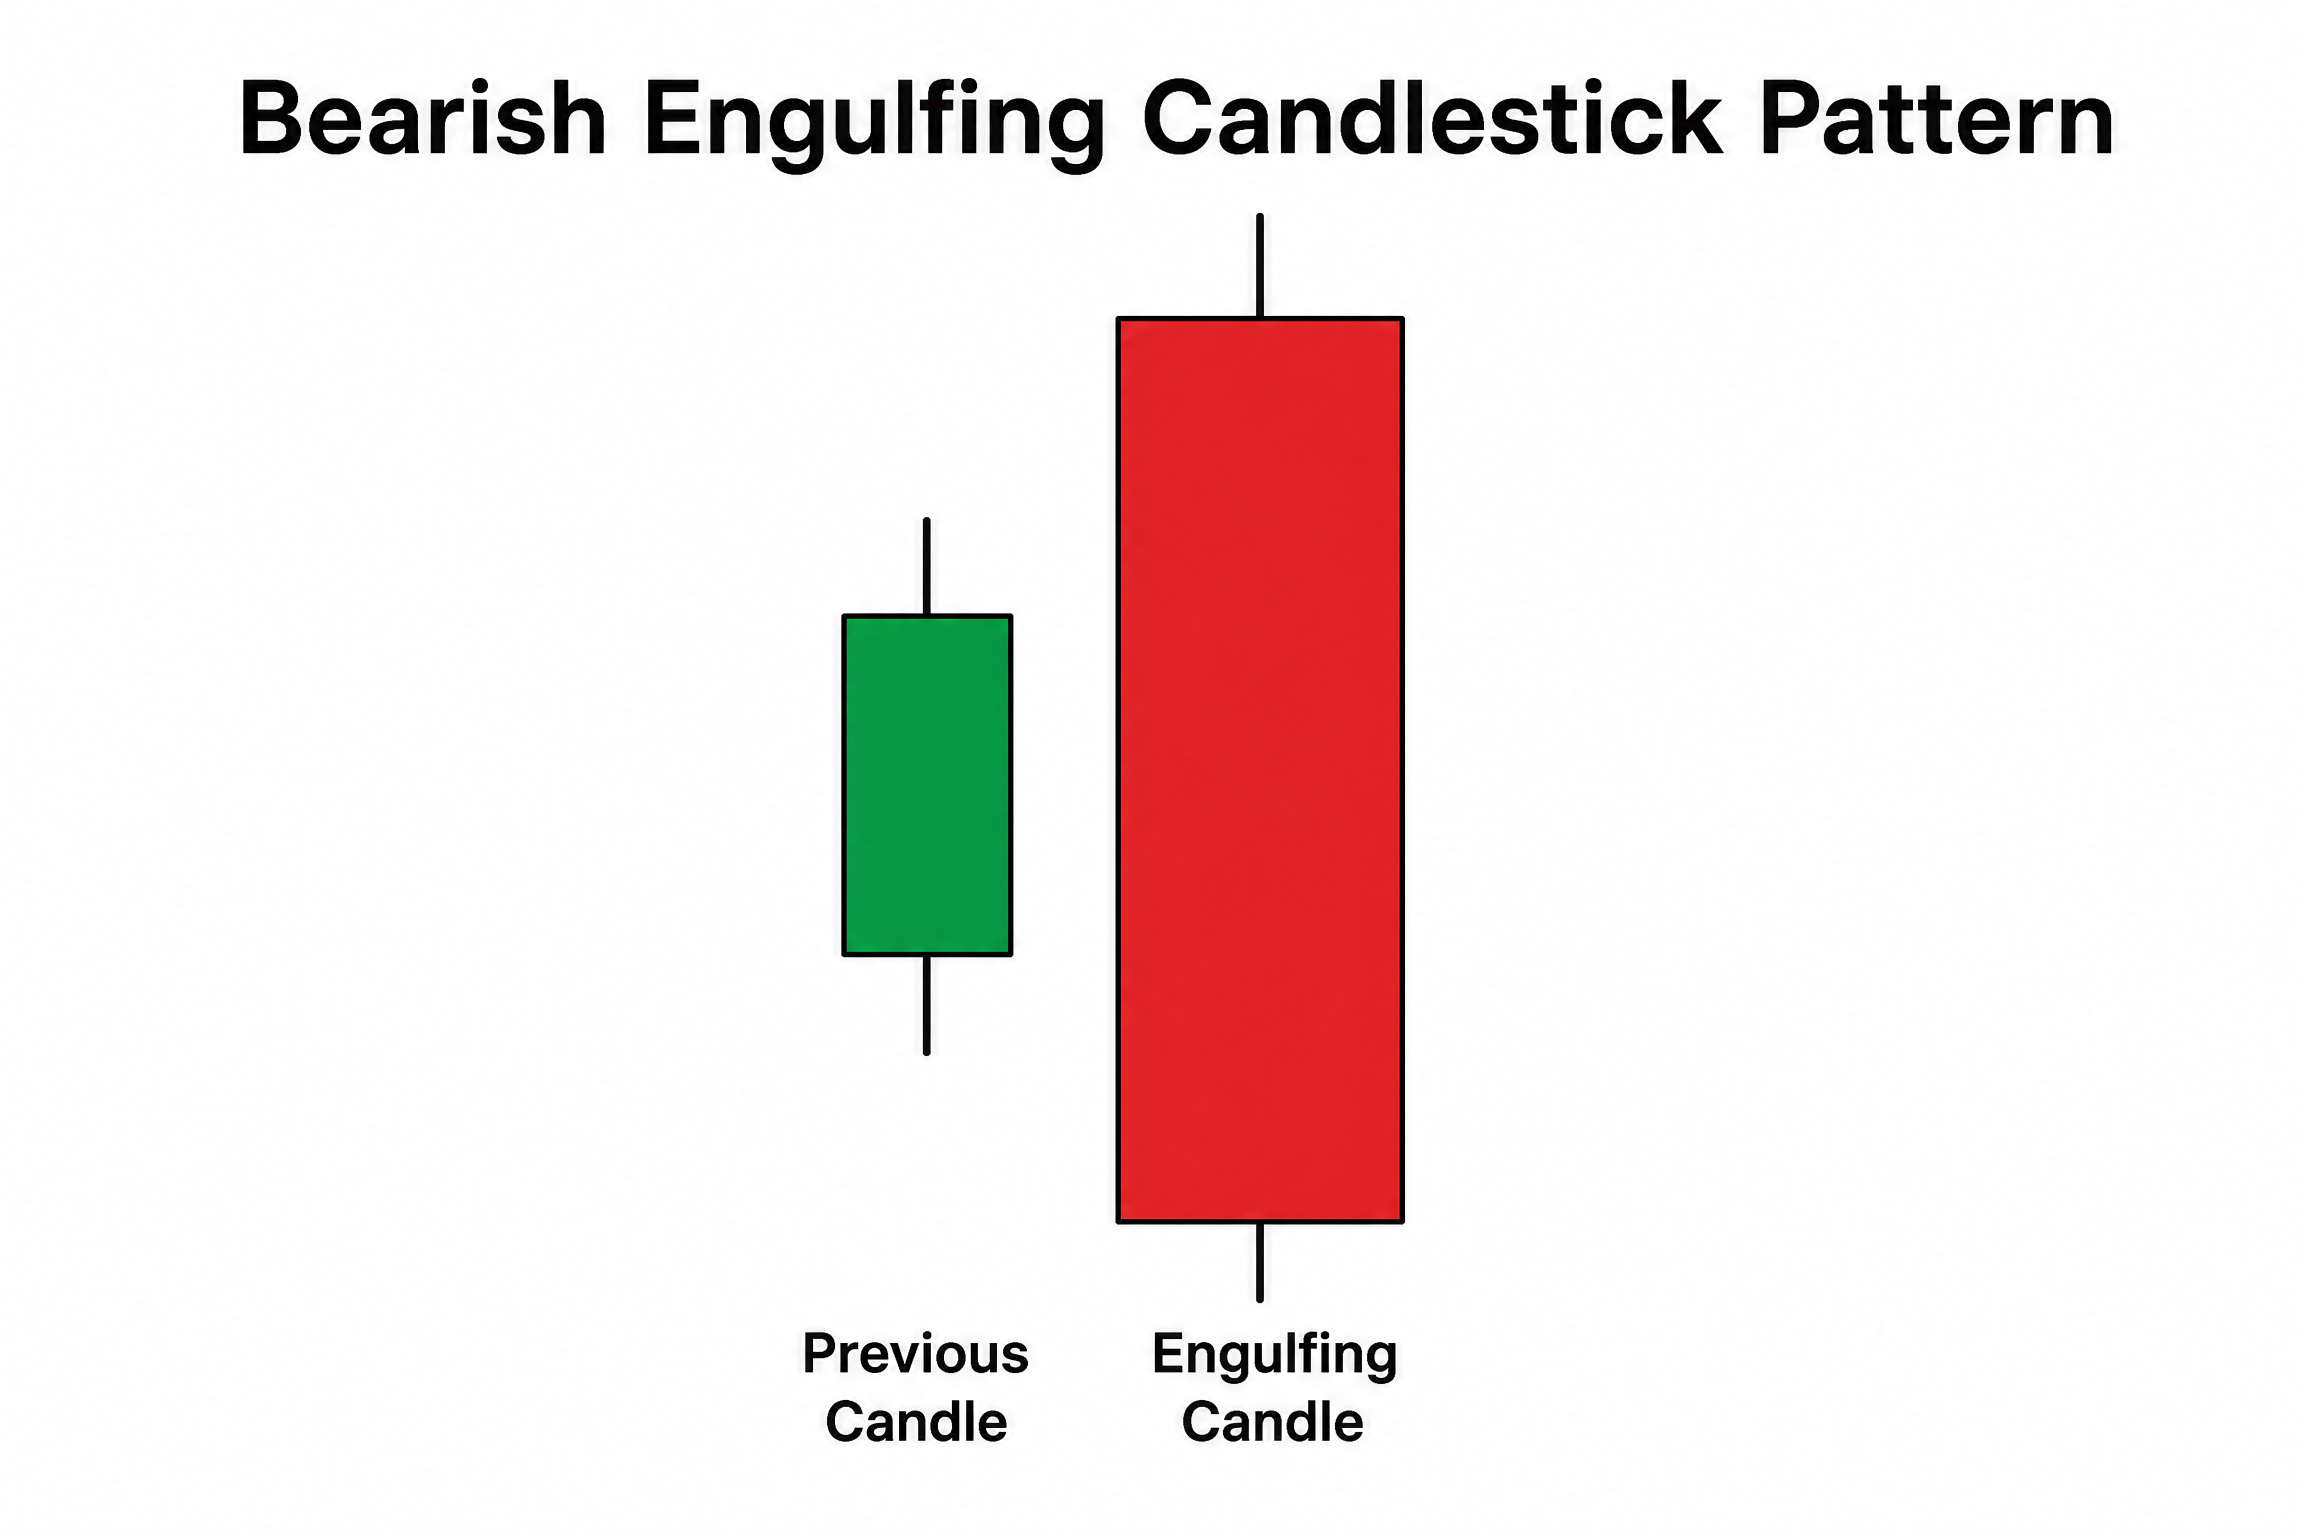
Think of this pattern as a "hostile takeover" on a chart.
It’s a two-candle formation that shows up at the top of an uptrend.
First, you have a small green candle, showing that the bulls are still trying to push higher.
But then, the next candle opens higher and then gets absolutely crushed by sellers.
This second red candle is so big that its body completely "engulfs" the previous green one.
IF YOU WANT TO TAKE YOUR STOCK INVESTMENT TO THE NEXT LEVEL, READ MY CAPITALIST EXPLOITS REVIEW HERE
Why This Pattern Actually Works
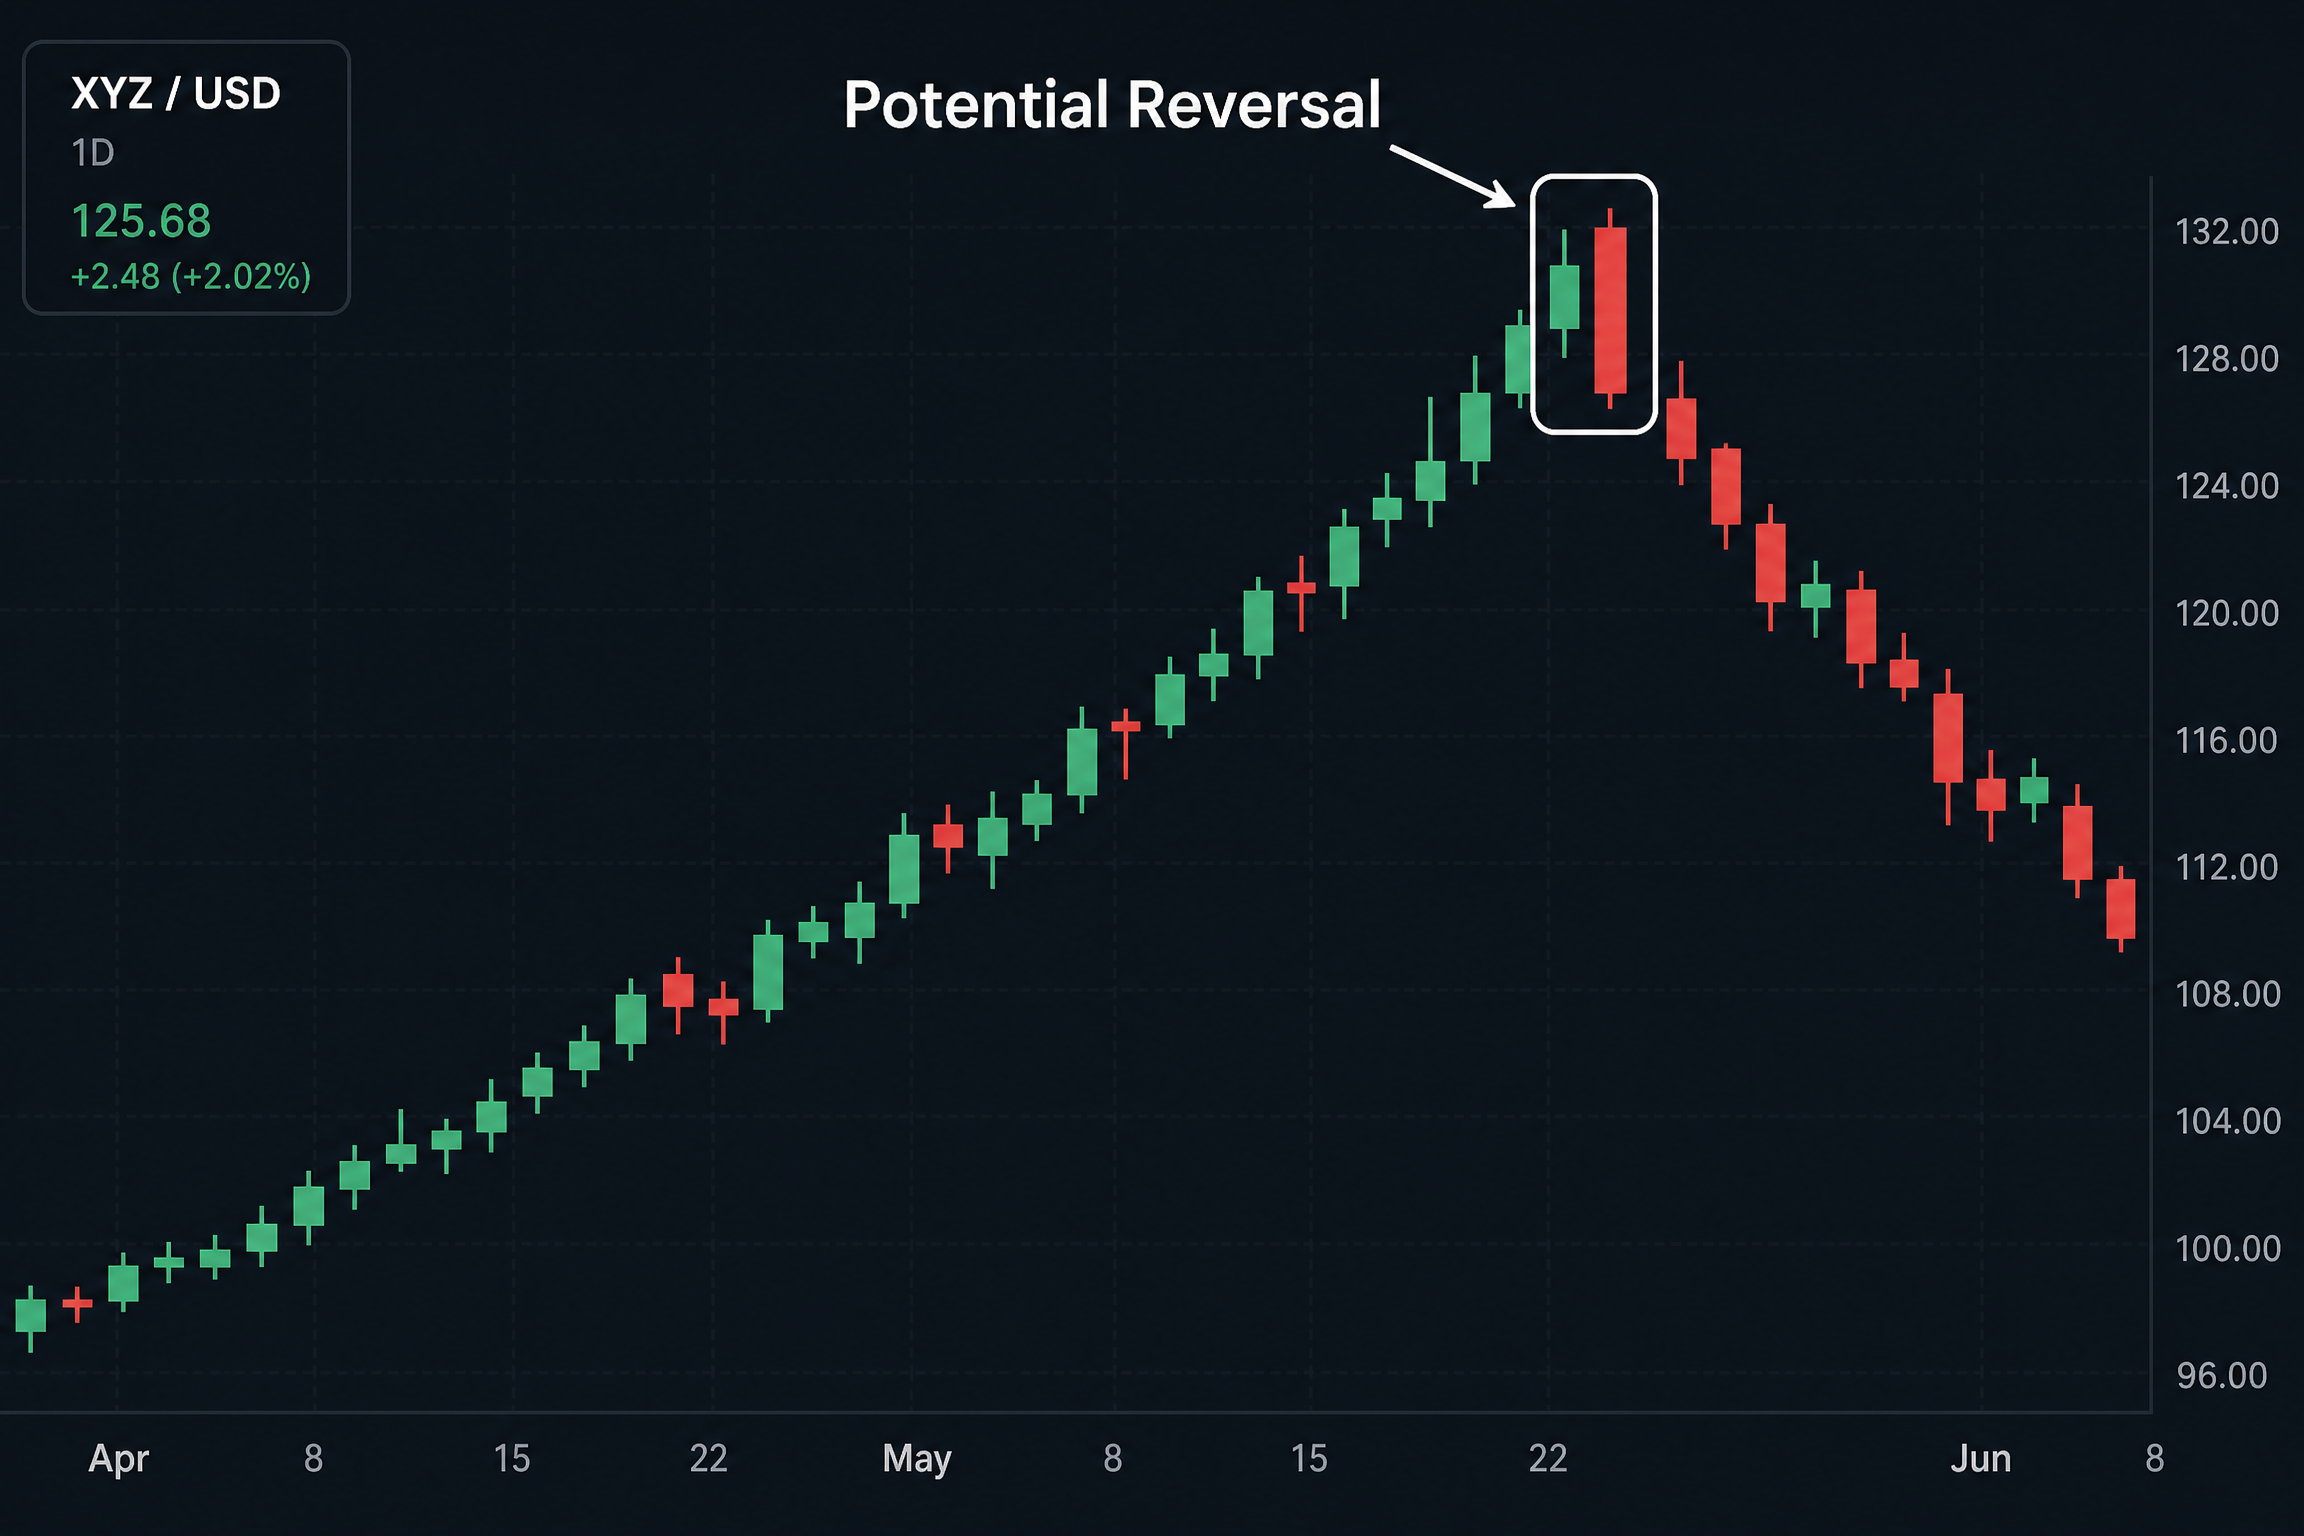
I’ve spent years looking at charts, and the reason this pattern is so real is because of the psychology behind it.
When that second candle opens higher, buyers feel confident, thinking the trend will continue.
But when sellers step in and push the price all the way below the previous day's low, it creates a sense of panic.
Trapped buyers start to sell their positions to cut losses, which adds more fuel to the downward move.
It’s a clear shift in momentum where the bears have officially taken the steering wheel.
You can check this trading patterns cheatsheet for more setups.
How to Spot a Tradable Setup
Not every engulfing candle is worth your time or money.
I always look for these three things before I even think about hitting the "sell" button:
•The Context: It MUST happen after a clear move up; if the market is just moving sideways, ignore it.
•The Size: The bigger the red candle compared to the green one, the more conviction the sellers have.
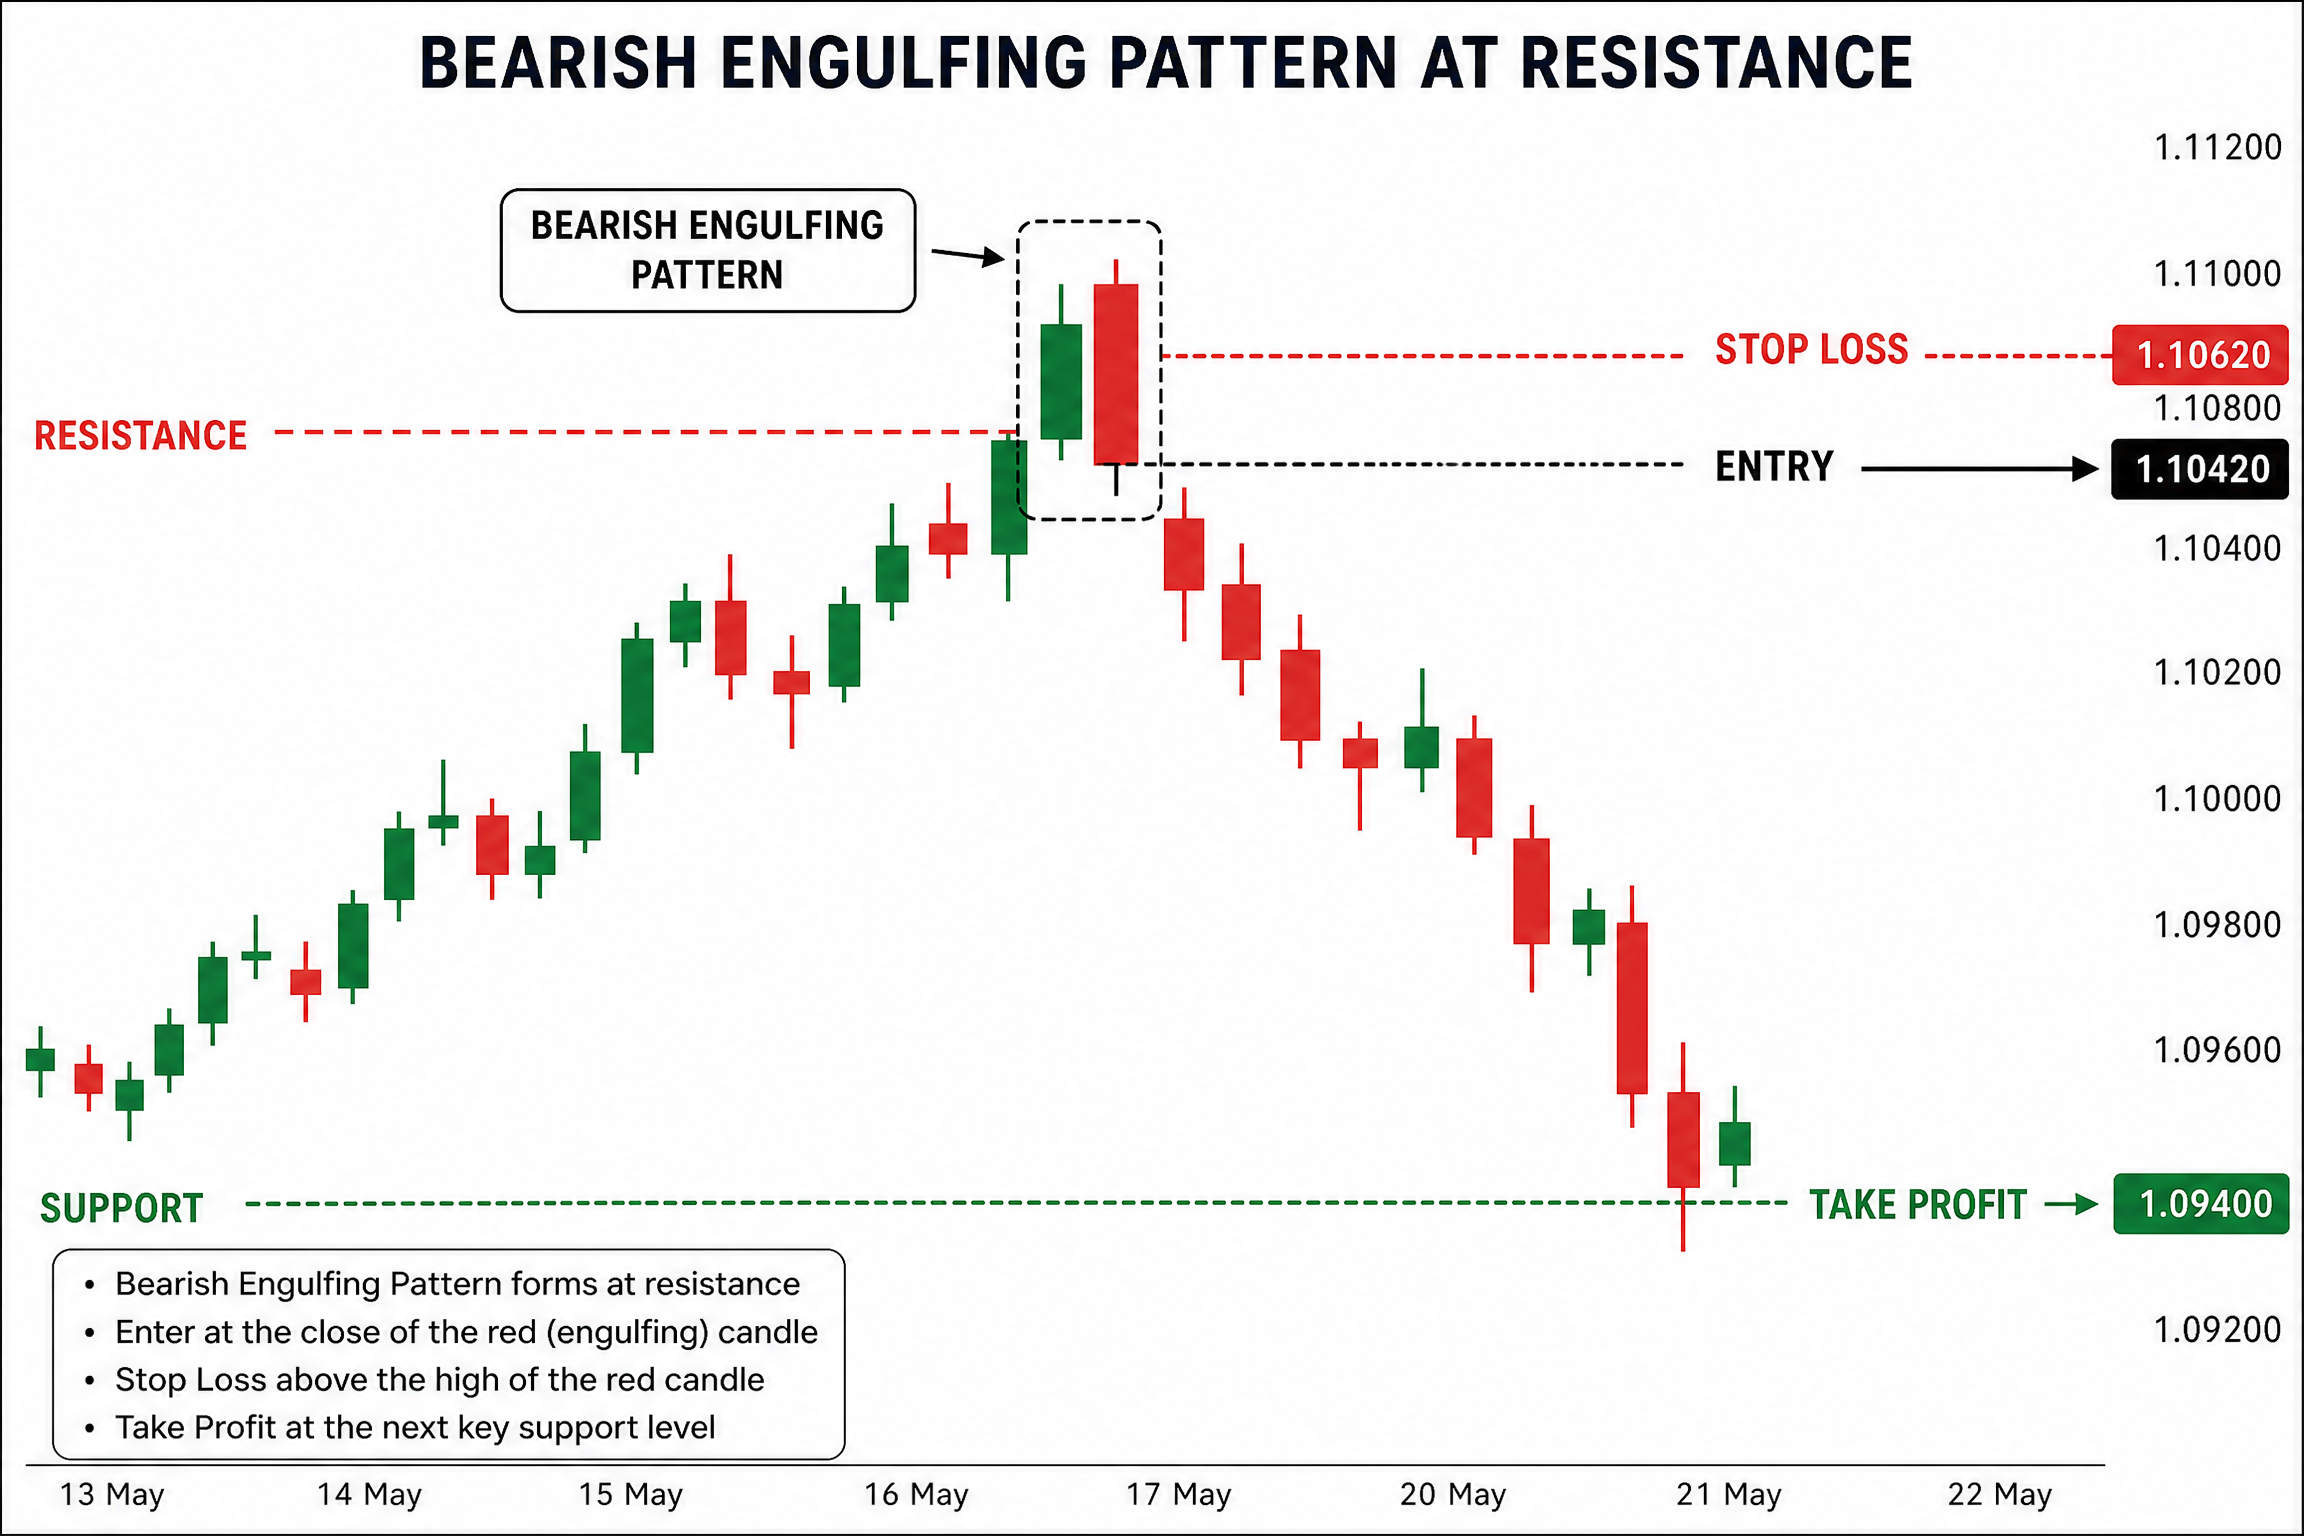
•The Location: If it happens right at a key resistance level or a previous high, it’s way more powerful.
If you see a tiny red candle that barely covers the green one, that’s usually just noise.
You want to see a big, "angry" red candle that says, "We are done going up!"
My Strategy for Trading the Bearish Engulfing Candlestick Pattern
When I see a solid setup, I don't just jump in blindly.
I like to wait for the candle to close to make sure the pattern is actually confirmed.
Here is a simple checklist I use for my entries:
1.Entry: Sell at the close of the large red engulfing candle.
2.Stop Loss: Place it just above the high of the engulfing candle to protect yourself if the market flips back.
3.Take Profit: Look for the next major support level or a previous swing low.
Don't Forget Confirmation
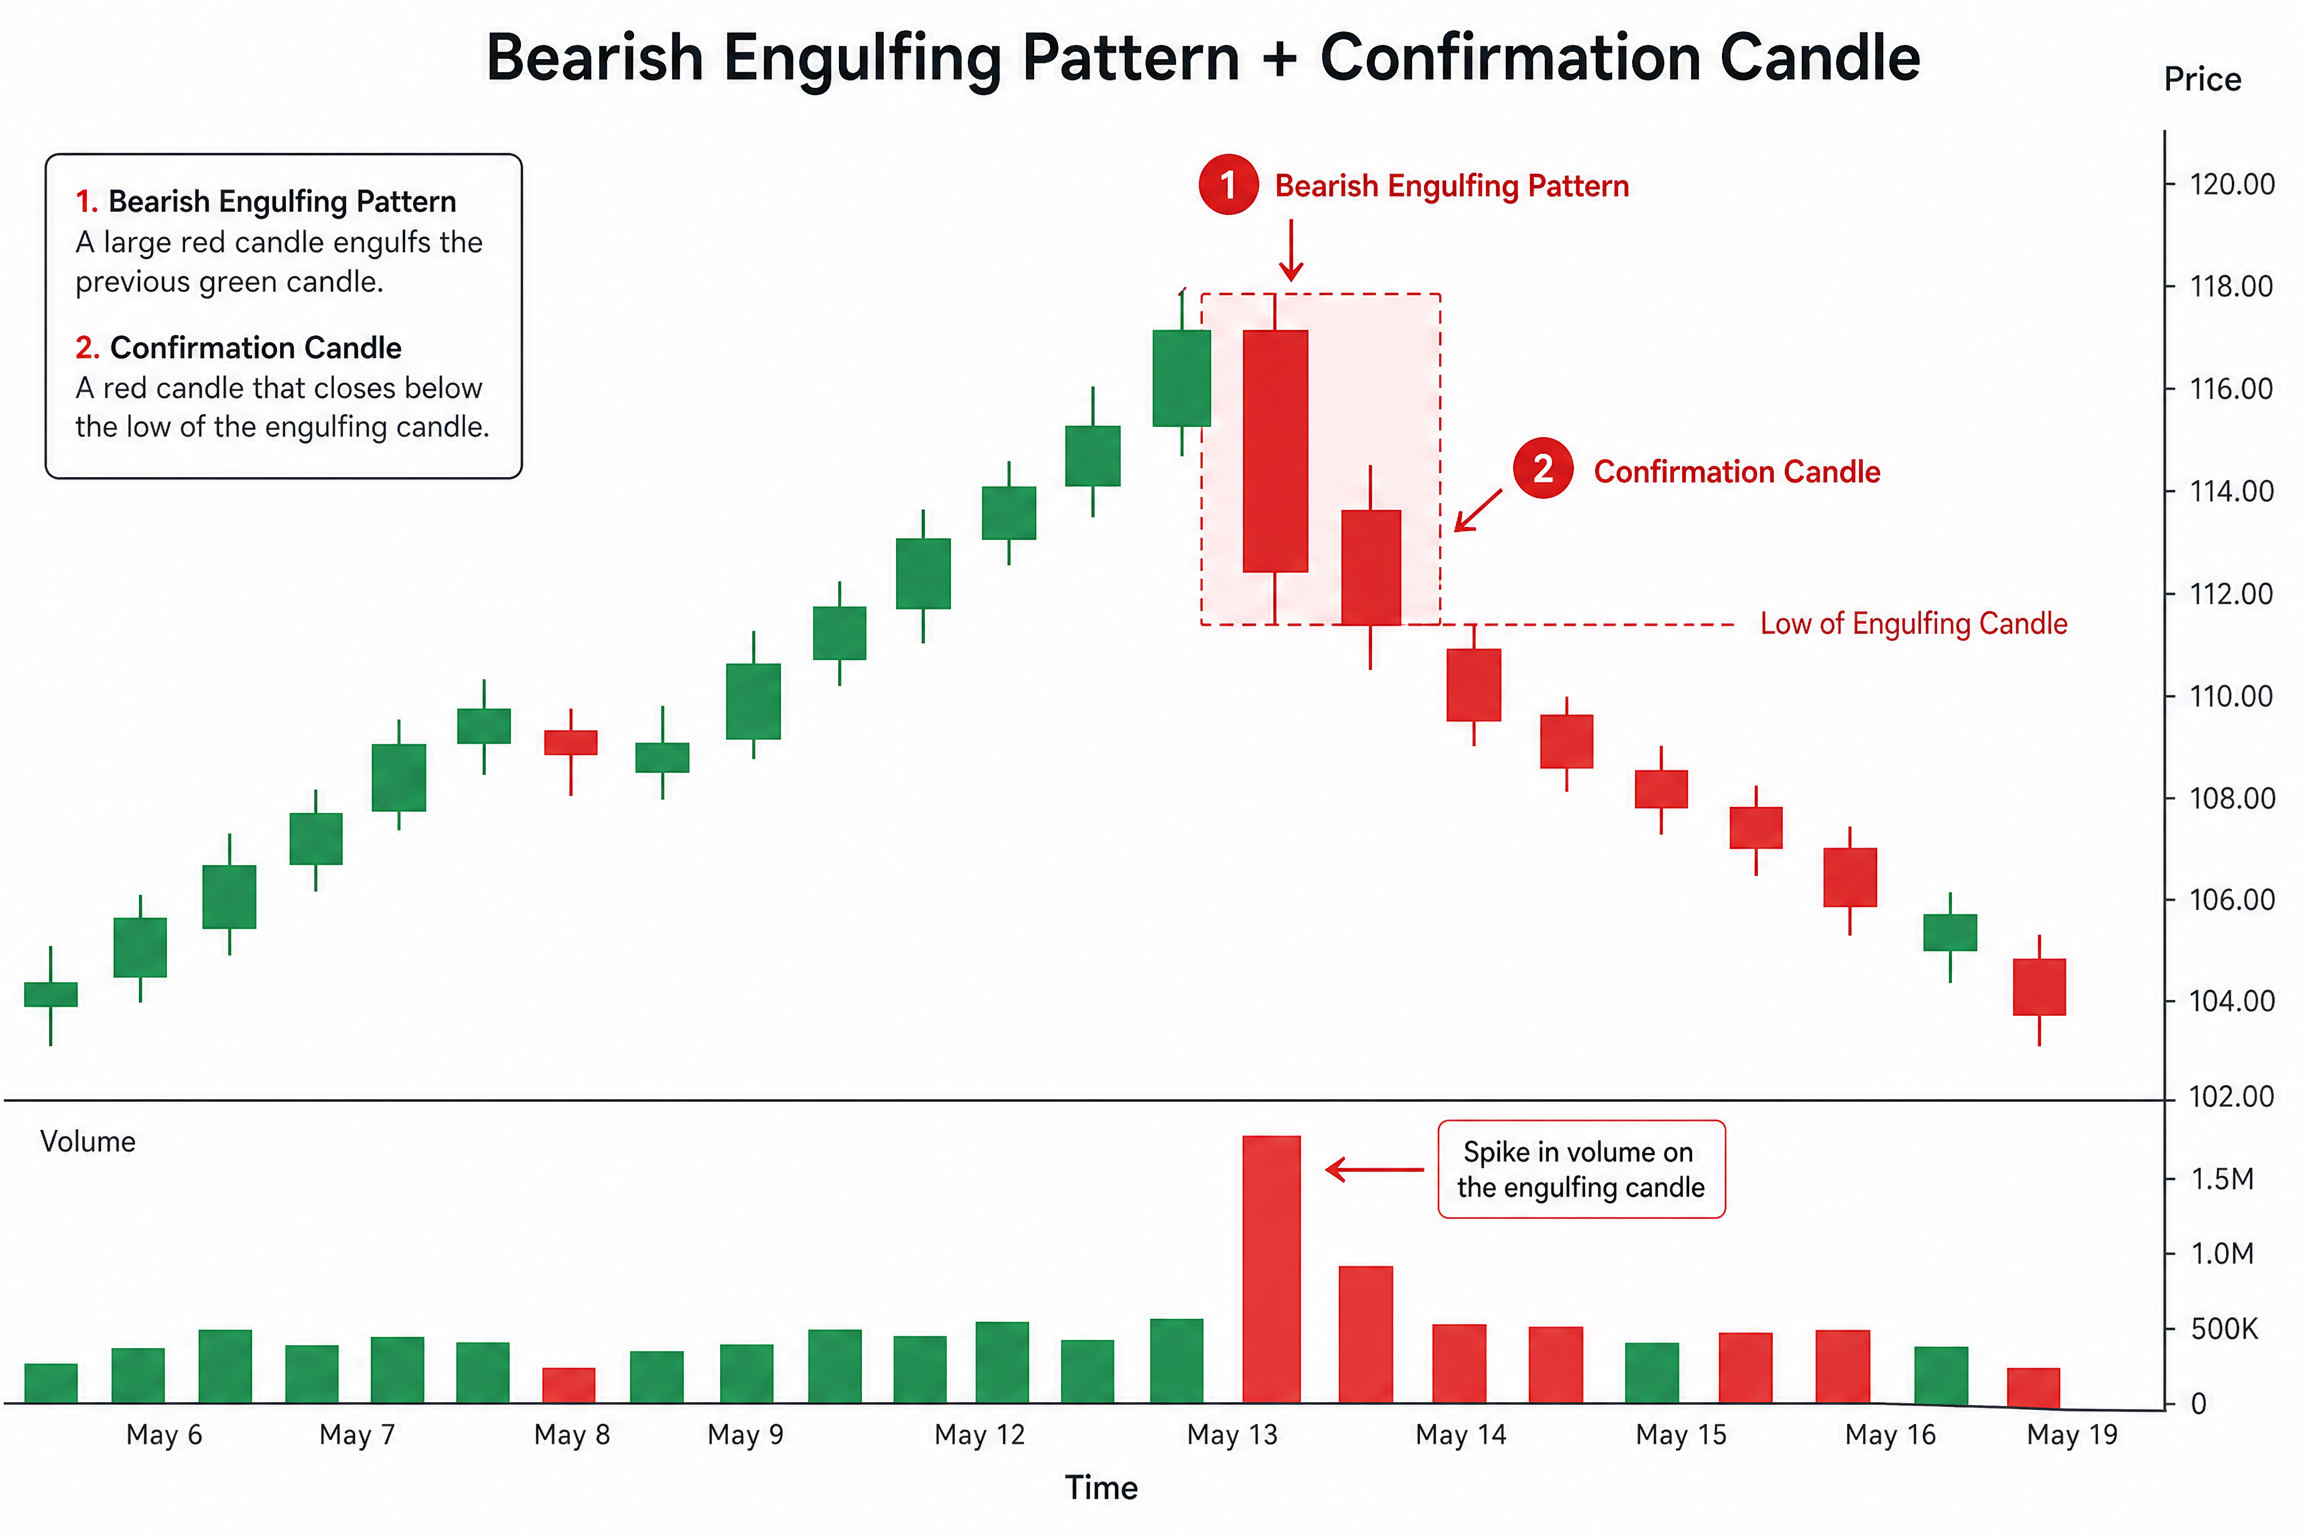
If you want to be extra safe, you can wait for a "confirmation candle."
This is just the next candle after the pattern that also closes lower.
I also like to check the volume; if the volume spikes on that big red candle, it’s a huge green light for me.
It means the big players are actually the ones doing the selling, not just a few retail traders.
Common Mistakes to Avoid
Even the best patterns can fail, and I've made plenty of mistakes learning this:
•Trading in a flat market: Engulfing candles mean nothing if there’s no trend to reverse.
•Ignoring the news: If a huge positive earnings report just dropped, a bearish candle might just be a temporary dip.
•Using low time frames: I find these patterns much more reliable on the Daily or 4-hour charts than on a 1-minute chart.
Keep it simple, wait for the right context, and don't chase every single candle you see.
Frequently Asked Questions
Question | Answer |
Is it 100% accurate? | No pattern is 100% accurate; always use a stop loss and manage your risk. |
Can I use it for crypto? | Absolutely, it works on stocks, forex, and crypto because human psychology is the same everywhere. |
What if the wicks aren't engulfed? | Most traders focus on the "body" of the candle, but it's even stronger if the wicks are engulfed too. |
Should I use other indicators? | Yes! Combining this with RSI (overbought) or Moving Averages makes it much more reliable. |
Trading is all about finding clues, and the Bearish Engulfing Candlestick Pattern is one of the loudest clues the market can give you.
Note: This article is for educational purposes only and does not constitute financial advice. Always do your own research before trading.


No comments:
Post a Comment